

Last year, Flowingdata came up with a dynamic visualization of the average day in the life of Americans. This visualization was based on data from the American Time Survey, consisting of questions measuring the amount of time people spend doing various activities throughout their day.
We at Sentiance thought this was a cool idea, so we decided to shamelessly copy, however with a little twist. Instead of relying on survey data, i.e. user declared activities, we decided to use mobile sensor data as a proxy for observed behavior.
We had a few thousand users install our mobile SDK, and used machine learning to automatically detect their home and work locations, their transport mode and real-time context, and the venue types they visited. All of this was learned automatically by fusing mobile sensor data such as accelerometer and gyroscope streams with the location subsystem.
Based on the resulting timelines, we trained a time varying Markov Chain model, and simulated a full 24-hour day of 1000 typical users, similar to the approach of Flowing data. We then dumped our data into the Flowingdata visualization and decided to share the result with you.
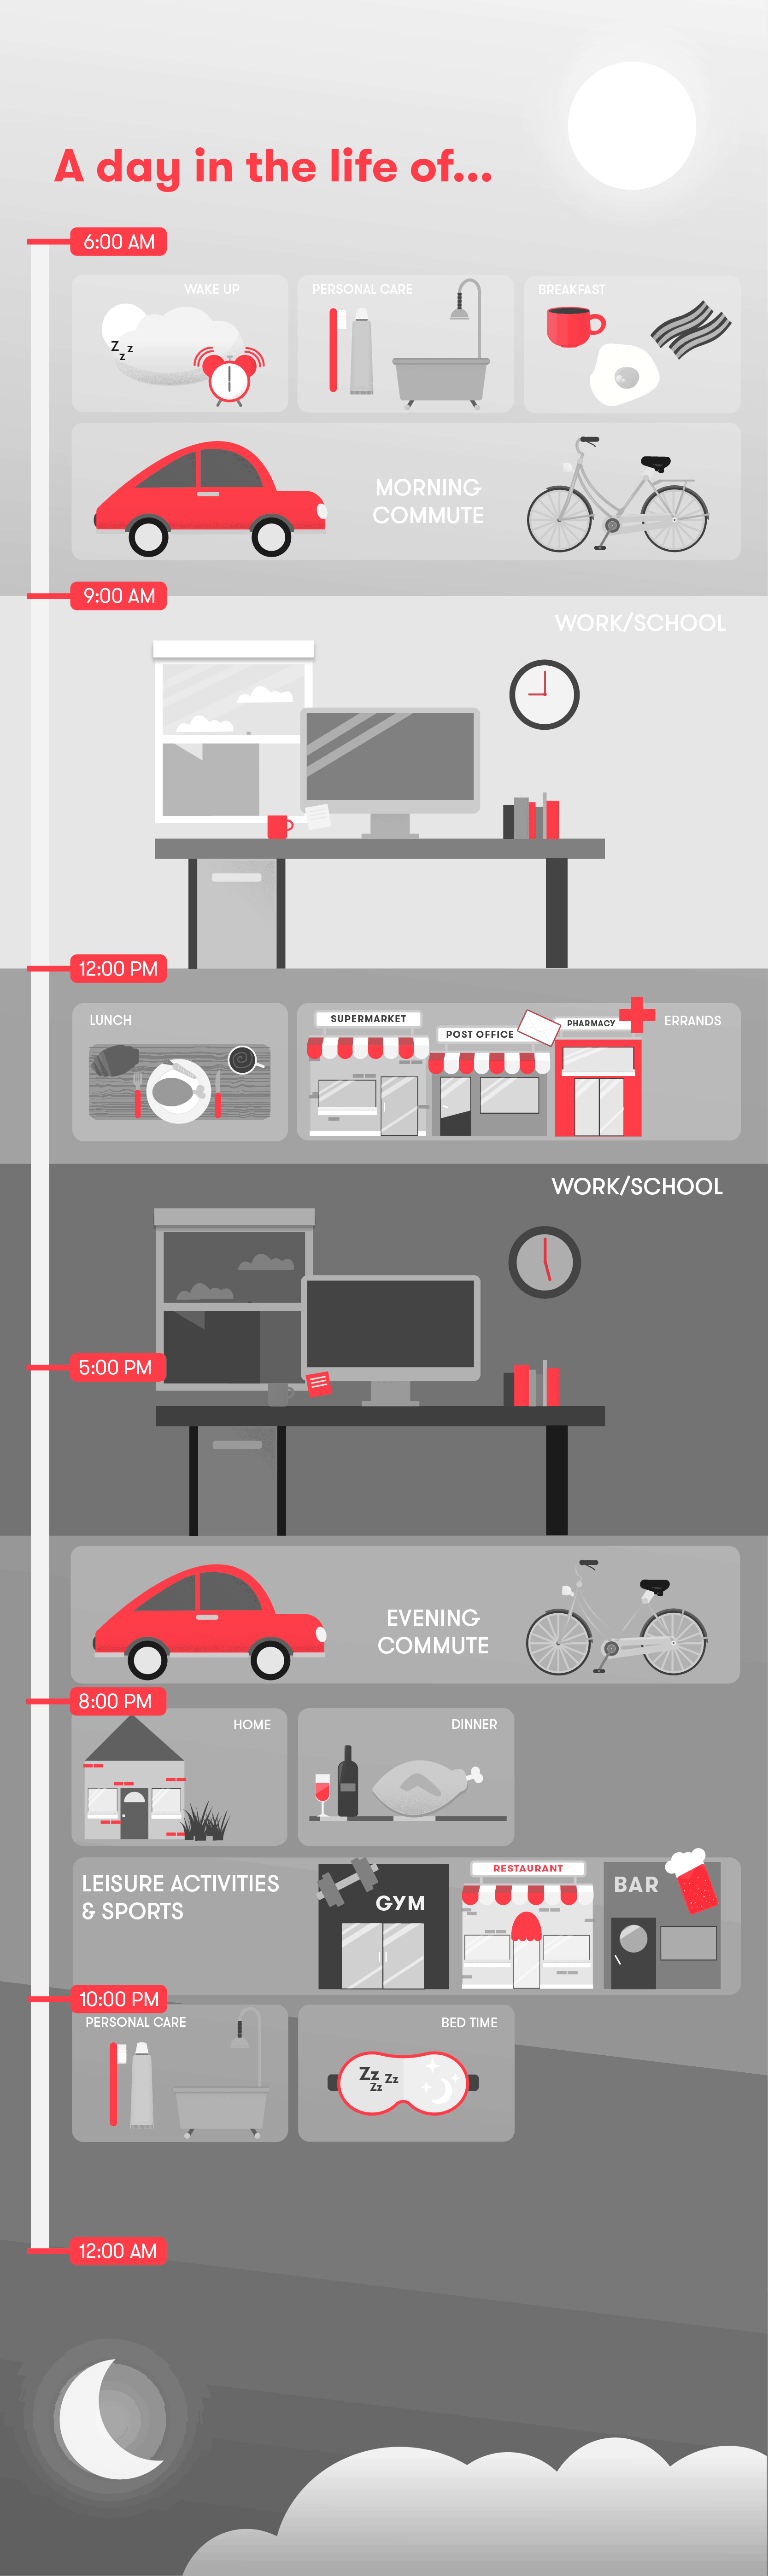
In the 24h-simulation below, you can see how a person allocates their time to different activities during the day and night. Basically we get a peek into people’s daily schedule on a typical weekday from when they get up, what they do and where they go throughout the day to when they check out and go to sleep.
Every dot represents a person; the dots move and change color depending on the activity throughout the day.
Rise and shine
At 5:00AM you see a couple of early birds moving to transport and work but most people are still asleep at this hour.
Around 7:00AM most people are waking up and getting ready for the day, after they’ve finished their morning rituals they head out to work or school.
At 10:00AM the day is in full swing, businesses and stores are open and people or either working, doing house chores or running their errands.
Pack-a-bunch during lunch
At noon, while the activity at work remains high, you see lots of people leaving the office to go for lunch, run some errands or rush off to various other activities. Seems like many people try to cram as much into their lunch breaks as they can.
9 to 5
Our typical workday still looks exactly like it did 50 years ago. In the visualization you clearly see most work activity between 9:00AM and roughly 4:00-6:00PM, when people start finishing up at work and commence their evening commute. While a majority heads home, others go out for dinner.
Shop until you drop?
As our visualization depicts a typical weekday and there doesn’t seem to be a peak shopping time, we can only assume that people leave most of their shopping trips to the weekend.
After eight we sit back and relax
Caloric intake or consumption? Restaurants & bars are heavily competing with sports. After 8:OOPM, it’s time for most to relax and unwind from a busy day. While some people indulge in leisure activities and sports, others prefer grabbing a nice bite to eat in their favorite restaurant or hit the town for some serious socializing
Sleep tight
At around 10:00PM people wind down for the day and shift from leisure time to personal care and sleep. By midnight 90% is sound asleep.
Creatures of habit
All these findings probably don’t seem as surprising as you’ve hoped them to be. Our daily lives on a typical weekday can seem rather repetitive and there is an obvious pattern in our weekday routines, we are ultimately creatures of habit. The majority of people get up and go to work during the week, and apart from some leisure activities here and there we’re all tucked up in bed before midnight. All very exciting indeed. Perhaps we should have given you a sneak peek into our thrilling weekend habits, we might just save that for some other time.
Big Brother is looking out for you
At Sentiance we believe in the power of context. Context, more than anything else, defines needs and intent. We use sensory devices to detect situational events and generate insights into real-time context and real-world behavior. Understanding a user’s situational context, especially when enriched with other behavioral profile or demographic data, will enable companies and brands to deliver more relevant and engaging customer experiences. Want to know how we position ourselves and our clients towards privacy, read all about it on our privacy page. Enabling context is not to control, but to assist, as your true big bro would do …
Side notes:
- Only a very limited subset of the event/context types that we can detect are shown. All the rest is summarized in the ‘other’ category.
- A more detailed explanation on our event and context detection pipeline is available here.
- The data shown is not real data (for privacy reasons): it is simulated data, generated by a statistical model that was trained on real data.
- Users were located mostly in Europe, and some in the US and UK.
- Most of our test users are working adults, with a bias to male geek professionals.
- We excluded weekends, so this shows a typical week day.


