
Three levels of location information
Most location-based technologies today consider only the literal meaning of the word location: an exact latitude/longitude pair. But to uncover the meaning of why people visit a place, location should be considered at different scales.
The answer to the question of where a person is, largely depends on the context and intent of that person. Imagine you are grabbing a quick lunch in Lovely Day, a hip Thai spot on Elizabeth Street in the middle of the Nolita shopping district, New York. Being asked where you are, can be answered in at least three ways:
- Level 1 - Exact location: I'm at Lovely Day, having lunch
- Level 2 - Nearby landmarks: I'm near Valley Nails, close to Paesant
- Level 3 - Intent: I'm spending my afternoon shopping in the Nolita district
The level 1 answer is what most venue mapping algorithms would return. The level 2 answer zooms out a bit, and describes which other venues are nearby instead of pin-pointing an exact venue. This is what most reverse geocoding services would return. The level 3 answer zooms out even further, and at the same time takes into account the relation between both nearby venues and venues further away. It describes the nature of the area the user is part of, instead of focusing just on the closest venues within a certain radius.
For many applications, the level 1 and level 2 answers are either irrelevant or misrepresent the user's intent. If you are spending the afternoon window shopping and strolling through the Nolita district, then any recommender or advertiser should probably focus on the level 3 answer. However, most traditional venue mapping solutions or reverse geocoding services only yield the level 1 and sometimes the level 2 answers.
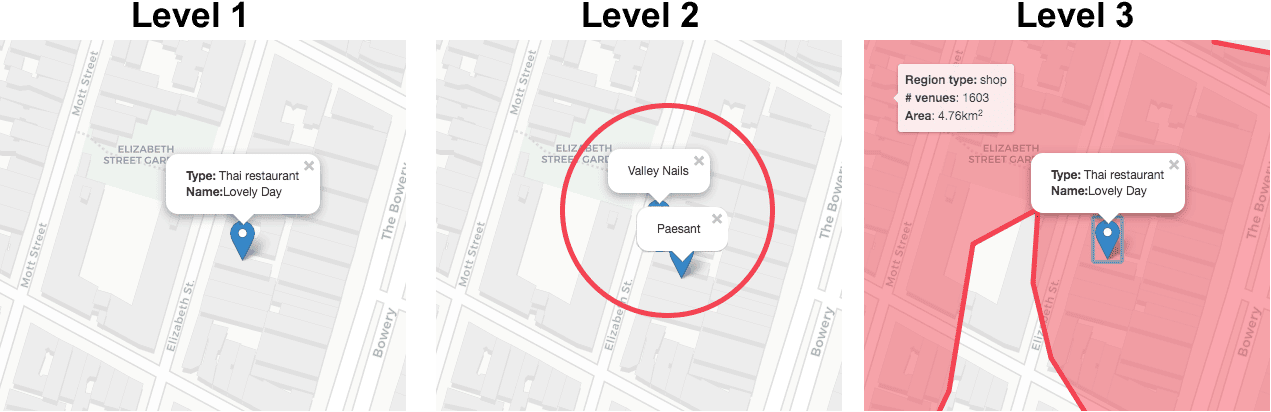
Figure 2: A user's location can be understood from different zoom levels. Traditional venue mapping and geocoding services focus on the first two levels only, either describing location by a venue name, or by nearby landmarks. A third level, delivering a macro-view that models inter-relations between the underlying micro-views is needed to move towards intent estimation.
The fact that the user in this example is in a large shopping district is of crucial importance if you want to target this user in a relevant and personal manner. The question then becomes: Can we dig deeper into the area types and subtypes, and can we create such a dataset with world-wide coverage, in a way that it can be queried easily and efficiently?
At Sentiance, we did exactly that!
A high level view of the world
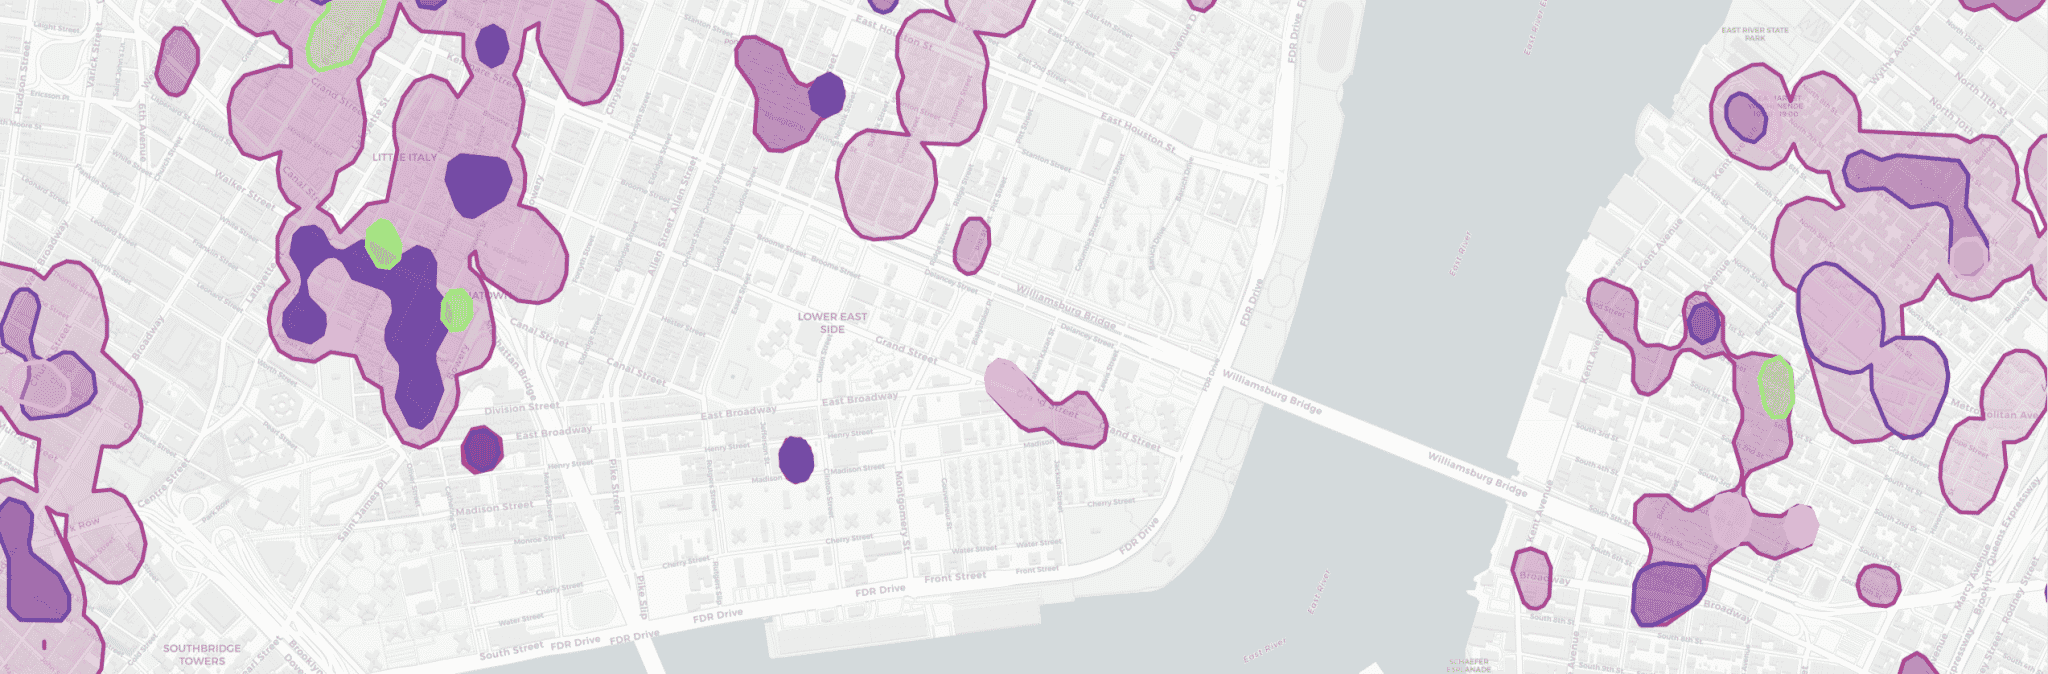
Before diving into the technical details, let's explore the result a bit. By querying our dataset to return clusters within a 1km radius around our New York office, we can inspect the result visually. In the below visualization, the opacity of a cluster is proportional to the venue density within the cluster, while different colors indicate different cluster types and subtypes.
Hover over the clusters with your mouse cursor to get more detailed cluster information, and toggle the different cluster types to see overlaps.
Note how some regions contain a hierarchy of nested clusters providing more detailed information. For example shopping areas contain sub-clusters such as retail-shop clusters or hobby-shop clusters or clusters related to home-goods, allowing us to fine-tune the way we interpret the user's actions.
If you ask anyone who has renovated a house in NYC for example, chances are they spent a considerable amount of time in the "homegoods" areas between Union Sq and the Flatiron building!
Below, we show a similar visualization of the clusters nearby our London office:
Finally, we show a similar visualization of the clusters nearby our Antwerp office:
Note that the absence of clusters at specific locations contains information on itself, as those areas usually correspond to residential areas or small towns.
A peek behind the curtain: How we did it
To obtain this level-3 view on the world, we combined different venue datasources. Duplicates are removed by means of fuzzy string matching, effectively calculating the Levenshtein distance between venue names. Finally, all venue types are mapped onto a common hierarchical topology.
A density based clustering approach was then used to identify areas of high venue density for each of these different region types such as retail shops, restaurants, bars, etc. As regions can be overlapping and can be of arbitrary shape, morphological operations were used to fine-tune the shape of each region and to merge neighboring clusters.
Alpha-shape contouring by means of Delaunay triangulation yields the final, often concave, cluster shapes. To be able to efficiently store and query those cluster polygons, the boundaries are simplified by means of the well known Ramer–Douglas–Peucker algorithm, allowing us to balance out efficiency and accuracy.
The result is a dataset of polygons, where each polygon is described with meta-information such as:
- How many venues are part of this polygon?
- What is the area of this polygon, in square meters?
- What is the type and subtype of this polygon?
The data is stored in a PostgreSQL database with the PostGis extension installed. PostGis is a spatial database extension that allows for efficient spatial indexing and querying. Using this extension, simple SQL queries can be used to figure out the region type of any location, world-wide. The following example shows how we fetch the region types of all clusters that are within 30 meters of a specific latitude/longitude coordinate pair:
SELECT region_type, venues_in_region, region_area_size, ST_AsGeoJSON(polygon) from world_regions_table

WHERE ST_DWithin(polygon, ST_Point(longitude, latitude), 30.0)
Some concrete use cases
Location based recommendation
Location based recommenders can make a user's life much easier. Car manufacturers, for example, often use location based recommendation for their in-car entertainment and navigation systems.
Recent location based recommender techniques take into account the user's past behavior, thereby recommending POI preferences from other users that exhibit similar behavior to the user under consideration. This is usually based on so called location-based social network data.
Level-3 region type information can greatly improve both accuracy and efficiency of location based recommenders in two ways:
- Nested region types can be used as pre-filters or post-filters to narrow down the recommendation possibilities in a smart and context-aware manner
- Region type information can be embedded or one-hot-encoded into a feature vector that can augment the other input features that are fed into the recommender system, thereby increasing its accuracy and relevance
Smart cities and crowd optimization
A compact dataset that segments the whole world in different, potentially overlapping, region types can be incredibly useful for smart city projects, urban planning and modeling crowd behavior.
Governments interested in studying tourist behavior or movement patterns of crowds can use this dataset to deepen their insights and provide explanations of the observed behavior.
Similarly, think tanks and research agencies can normalize their observations by region type, in order to take into account different, often unknown, latent factors that drive and motivate people's behavior.
Location based advertising
Location based advertising (LBA) has been proven to significantly increase engagement for mobile advertising. Studies show that for every mile of distance between a user and a store for which a promotion is received, the likelihood of clicking on that promotion decreases by almost 25%.
However, in the current mobile first era, LBA has become mainstream, and advertisers have to start looking for different ways to engage with their audience in a more personalized way. Context and intent of the user has been shown to have a huge impact on their propensity.
For example, when people are in groups or in crowded places, they are more likely to react to notifications via their smartphones and have been shown to be twice as likely to engage with a promotion.
The dataset discussed in this article can directly be used to efficiently estimate a user's intent and understand its surroundings. This allows for a much richer targeting then purely depending on location and distance.
Venue mapping: How we use this at Sentiance
Over the past few years, Sentiance has been building the world's most sophisticated AI platform for behavioral modeling, prediction and analysis. Our mobile SDK queries the phone's accelerometer and gyroscope sensors and feeds this data, combined with location information, into our machine learning pipeline.
Our backend then transforms this low-level data into four different types of insights:
- Events: What is the user doing? (e.g. transport mode, venue mapping, home/work detection)
- Predictions: What is the user expected to do next?
- Moments: Why is the user doing this? (e.g. commute, shopping routine, business trip, etc.)
- Segments: Who is this user? (e.g. shopaholic, uber-parent, pet-owner, heavy commuter, etc.)
These insights are combined to contextualize people's journey and to ease their life, e.g. by means of health coaching or by providing mobility recommendations.

Figure 1: A user's timeline as detected and predicted by the Sentiance platform.
A small but important part of the event layer, is our venue mapping solution. Venue mapping refers to the act of figuring out which place a user is visiting, given an often inaccurate location fix, a set of possible candidate venues from a GIS database, and our knowledge about the user's past behavior and preferences. Figuring out the exact venue the user is likely visiting is a difficult thing to do and was solved at Sentiance by combining advanced deep learning techniques with more traditional GIS processing.
The dataset discussed in this article yields features that power an important part of our final venue mapping solution.
How you can use our dataset
While creating the dataset was hard, using this data is extremely easy. We provide our customers with a simple offload file, shared through a download link on Amazon S3. Our customers then own the dataset, and can process it as desired.
Most customers simply import the file into an SQL database which they can then easily query. Figuring out which region types a given location belongs to then boils down to executing a small SQL query.
Because we use this data internally too, as part of our venue mapping solution, we provide quarterly updates which are happily shared with our customers.
Don't hesitate to contact us if you would like to receive a sample of the data, for a specific region or city!


