

Key Insights
- Physical interaction decreased by 76% per person on average
- 60% of our population sample avoids meeting other people
- Social distancing measures are significantly slowing down the spread of the virus
- 91% works from home, compared to 36% before the crisis
- We observe 77% less car trips
- Visits to gyms dropped 84%, visits to shops dropped 20%
- Parents and students set the best example by staying home the most
- 15% CO2 reduction due to a drop in vehicular mobility
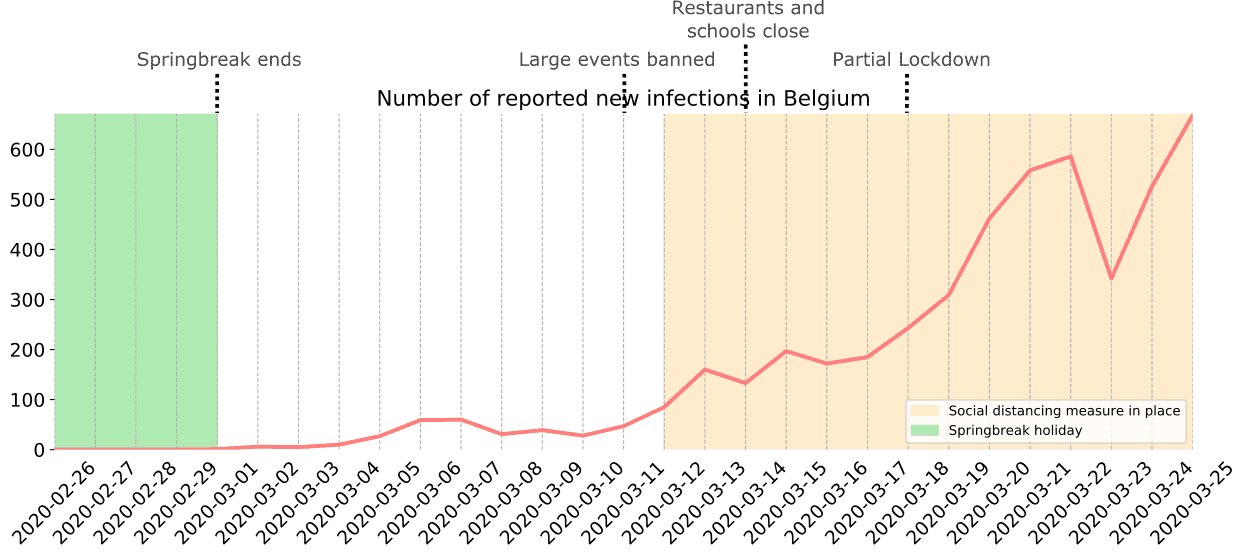
A timeline of COVID-19 in Belgium
Although the first Corona case in Belgium was confirmed on February 4, reported cases only started increasing rapidly after the 1st of March, when spring break ended, and people came home from their skiing trips in Italy and France.
By March 10, the number of confirmed cases was 267, and federal government decided to ban all events hosting more than 1000 people. Working from home was advised but not enforced, and travel was still allowed.
From Friday March 13 at midnight, bars and restaurants were closed, and school activities were suspended. However, people were not required to stay at home until the partial lockdown announcement on March 17. From that day onwards, non-essential travel was prohibited, non-essential shops closed, and police was given the means to enforce strict social distancing measures.
To measure the effects of these social distancing measures, we teamed up with our partner For Good, whose app monitors your ecological footprint and sustainability behavior. In this article, we present an in-depth analysis based on data gathered from over 5000 Belgian users during the past few weeks.
Social distancing reduces the effective reproduction number
The spread of a virus is defined by its basic reproduction number R0, which is the average number of people that an infectious person infects. In the case of COVID-19, the basic reproduction number is currently assumed to be around 2.3.
The goal of social distancing is to bring down the effective reproduction number R, by reducing the number of people that are involved in physical interaction. The effect of social distancing is exponential in the decrease of interaction. To roughly estimate the effective reproduction number, we can use the very basic model of social distancing as introduced by Becker et al.:
![\[R=[1-(1-a^{2})f]R_{0}\]](https://sentiance.com/wp-content/ql-cache/quicklatex.com-2bfd3475dbf3ad8770028fa90a0a9d61_l3.png "Rendered by QuickLaTeX.com")
Where  represents the fraction of interpersonal contacts that people maintain during social distancing, and
  represents the proportion of the population that engages in social distancing.
For example, if everyone decreases their physical interaction to 50% of what they are used to, then the effective reproduction number decreases with 75% to 25% of its original value according to this simplified model.
This exponential effect can be understood by the following visualization which shows the effect of physical interaction between two For Good users (User 1 and User 2).
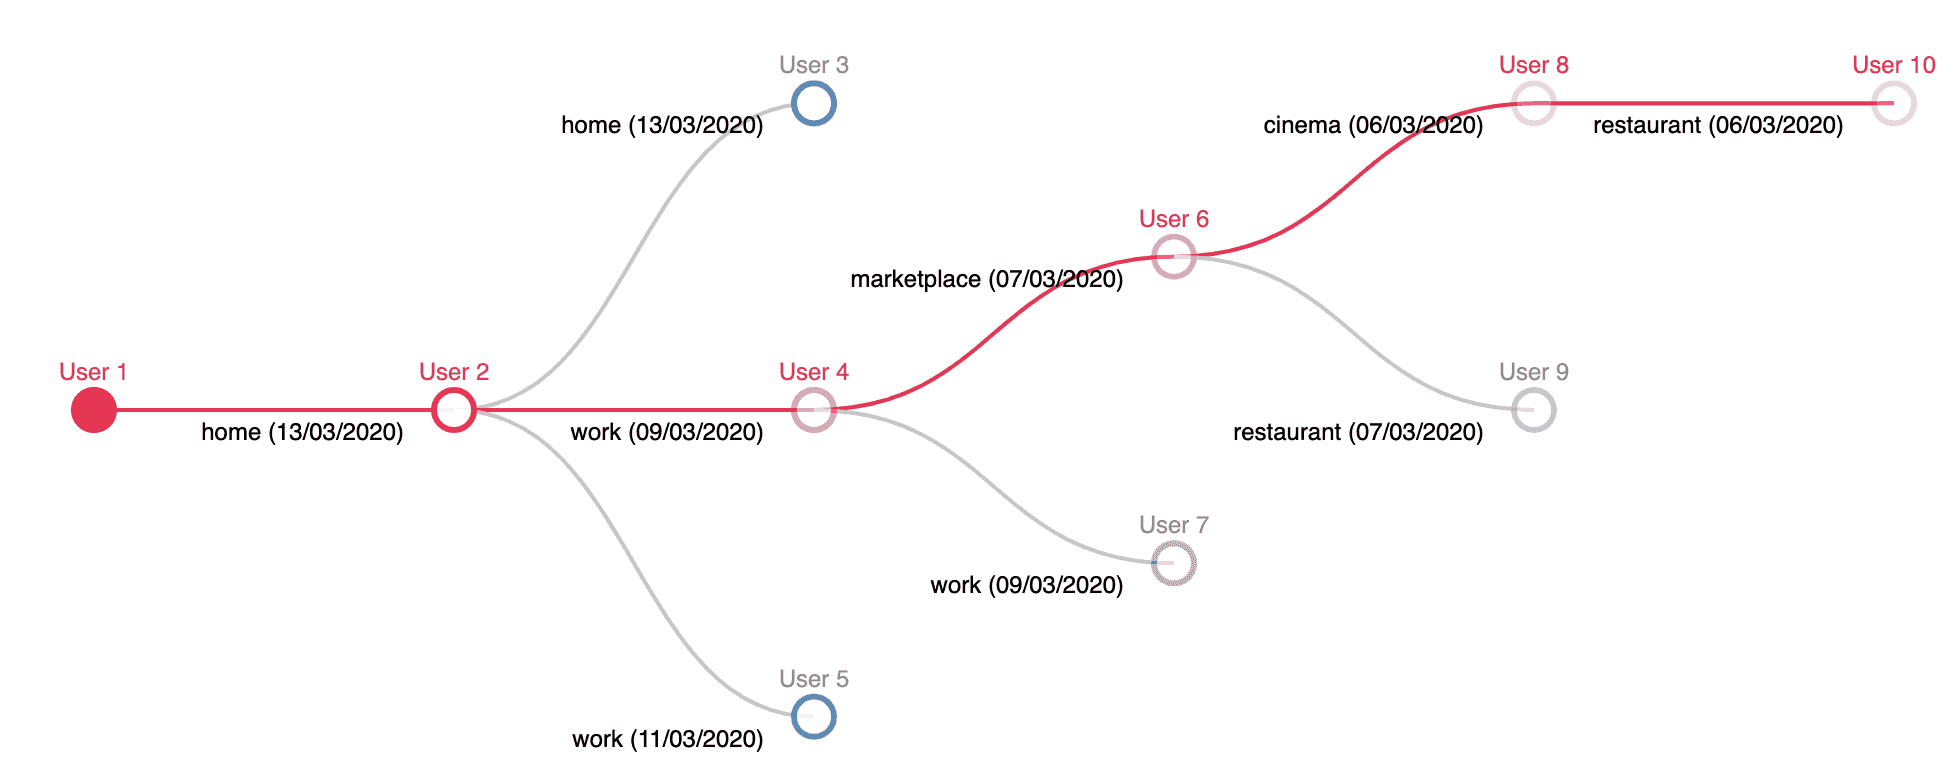
Each node in this graph represents a user, while an edge between two users means that those users physically met at a certain location on a specific date in the past week. Although User 1 only met one person directly, this graph shows that the user met at least 9 users indirectly, and could potentially get infected by User 10, without ever meeting that user in person.
Although this graph only shows the risk of User 1 meeting User 2, we could go further and visualize the risk for a user based on all people he or she met in the past 10 days. This is shown below, where the size of the circles corresponds to the number of social relations we detected for that user. Big circles therefore are potential super-spreaders.
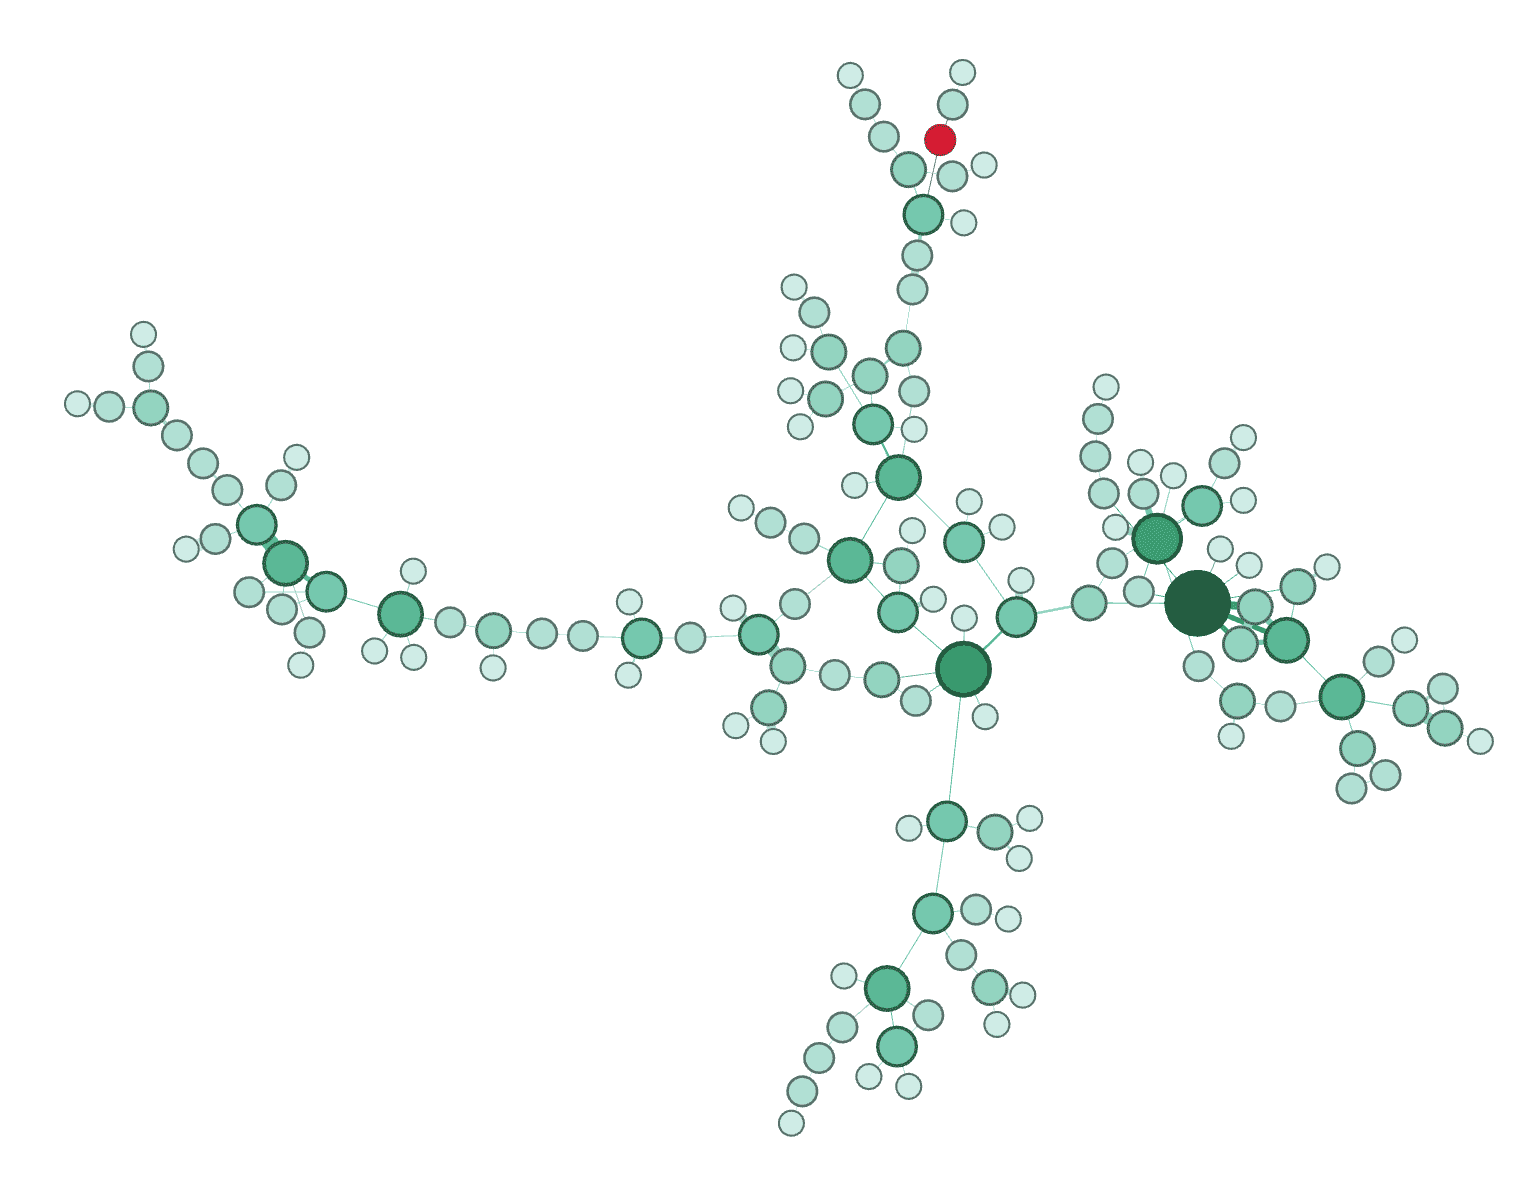
It is clear that this risk grows exponentially with the amount of social interaction per user. However, the above also shows that the risk depends on a second factor, namely the proportion of the population that engages in social distancing. If only half of the population reduces its physical interaction to 50%, then the effective reproduction number decreases only with 37.5% to 62.5% of its original value.
Note that the social distancing model used here is highly simplified. In reality, many parameters influence the effective reproduction number, and social connectivity is merely a proxy for transmission. For example, timing is an important parameter that we largely neglect in our analysis, for the sake of simplicity. If people are only infectious for a few days, then the sequence of interaction plays an important role. A more advanced model would therefore take into account the stochastic nature of this problem.
To estimate the effective reproduction number, based on our simplified model of social distancing, we thus need an estimate of the following two parameters:
- The proportion of the population that engages in social distancing
- The reduction in physical interaction for those that engage in social distancing
In the next section, we will try to measure both parameters, to come to a rough estimate of the effective reproduction number, based on the tracked behavior of 5000 users.
Estimating the effective reproduction number
1) Estimating the population proportion
In the following figure, we visualize how many people, out of the tracked users, had any physical interaction with other users from that same tracked population. We clearly see a significant drop in the number of users that engage in social activity from March 10 onwards. In fact, the number of interacting users dropped from 360 on March 10, to 142 on March 25.
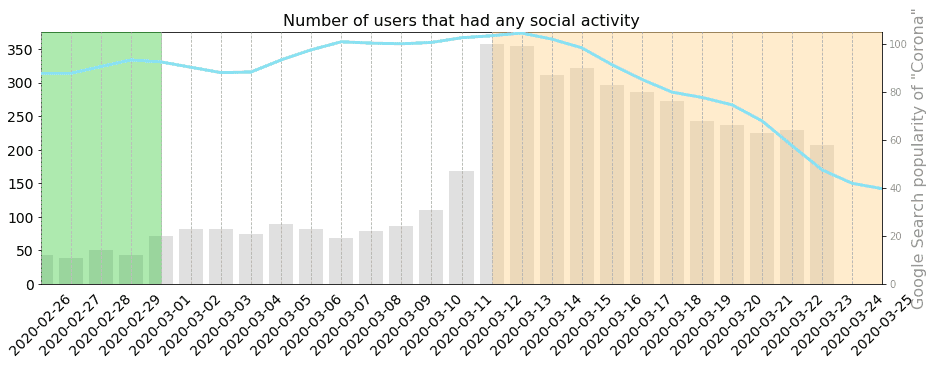
Although social distancing doesn’t necessarily have to amount in zero physical interaction for a user, the probability that two users meet by chance in our small population is negligible. Therefore, these numbers yield an estimated 60% of the population that strictly engages in social distancing.
2) Estimating the reduction in physical interaction
The second parameter to be estimated, is the average reduction in physical interaction for this 60% of the population that engages in social distancing.
The following figure shows how the total number of physical interactions between our For Good users decreased over time. Important to note is that, although the number of direct interactions is quite small, the corresponding number of indirect interactions is much larger, due to the exponential effect discussed earlier.
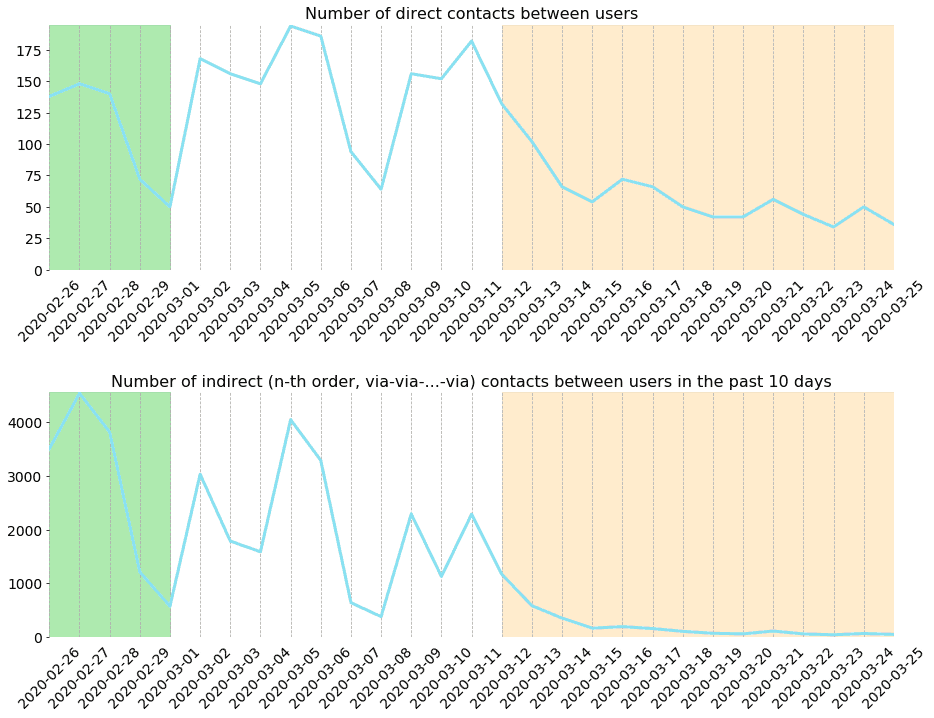
This shows that the number of direct physical interactions dropped from 152 on March 10, to only 36 on March 25. Therefore, we can roughly assume that users who engage in social distancing reduce their interaction to less than 24% of their original behavior.
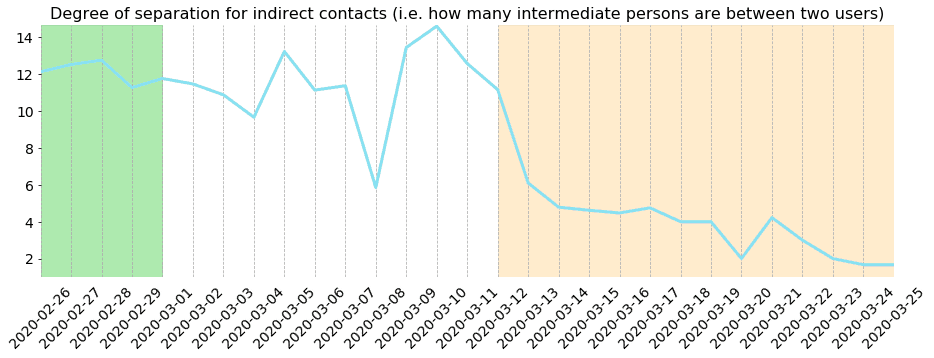
This reduction in physical interaction results in a significant reduction in social reach as illustrated below. Whereas on March 10th, some users were still indirectly connected to other users by no less than 14 intermediate persons on average, that number reduced to only 1 on March 25.
3) A rough estimate of the effective reproduction number
As stated above, we assume a basic reproduction number of 2.3. Given our estimate that roughly 60% of the population engages in strict social distancing while participants reduce their social interaction to a fraction of only 24%, we can now estimate the effective reproduction number as  , which is lower than the basic reproduction number of the seasonal flu.
Note that we made a lot of assumptions and simplifications in this analysis, and that the estimated reproduction number should not be considered scientifically sound, partially due to the small sample size. However, our analysis does show the importance and effects of social distancing measures with respect to reducing the speed at which the virus can spread.
The effect of social distancing on mobility
People stay at home and avoid vehicular transport
An important instigator for today’s social distancing behavior, is the government-imposed partial lockdown which comes with strong incentives for employers to let their employees work from home. The following graph shows how the fraction of people working from home increased significantly over the past few days, while the distance traveled by car decreased accordingly.
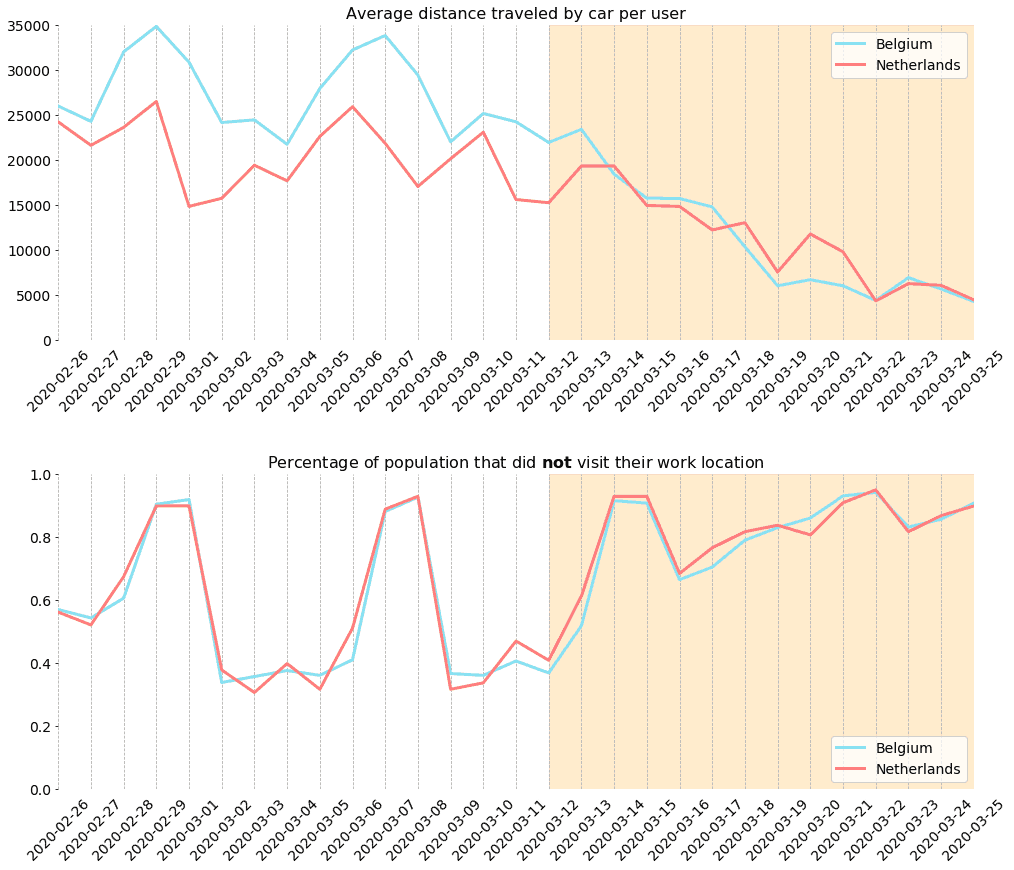
Whereas on March 10th only 36% of the population worked from home, that fraction increased to 91% by March 25. Interestingly, these effects seem to be similar for the Netherlands, where similar measures have been taken by government.
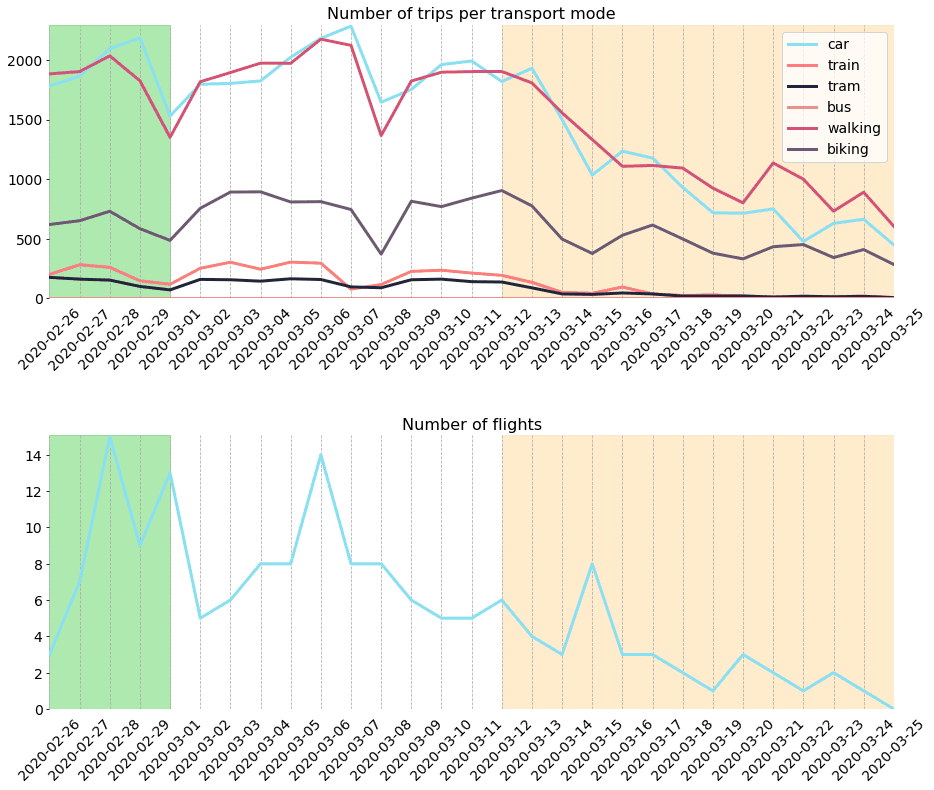
Moreover, as illustrated below, a similar decline in transportation is observed for other vehicular transport modes such as train, tram, bus and flights. On the other hand, the number of biking trips remained relatively stable, and more walking trips than car trips are being observed today, indicating that people still go out, albeit for shorter distances.
The question then remains which types of venues people still visit. To answer that question, we plotted the average visit duration against the number of visits for different venue types. In the chart below, the left side shows people’s behavior in the week before government measures were announced, whereas the right plot shows the behavior after the partial lockdown.
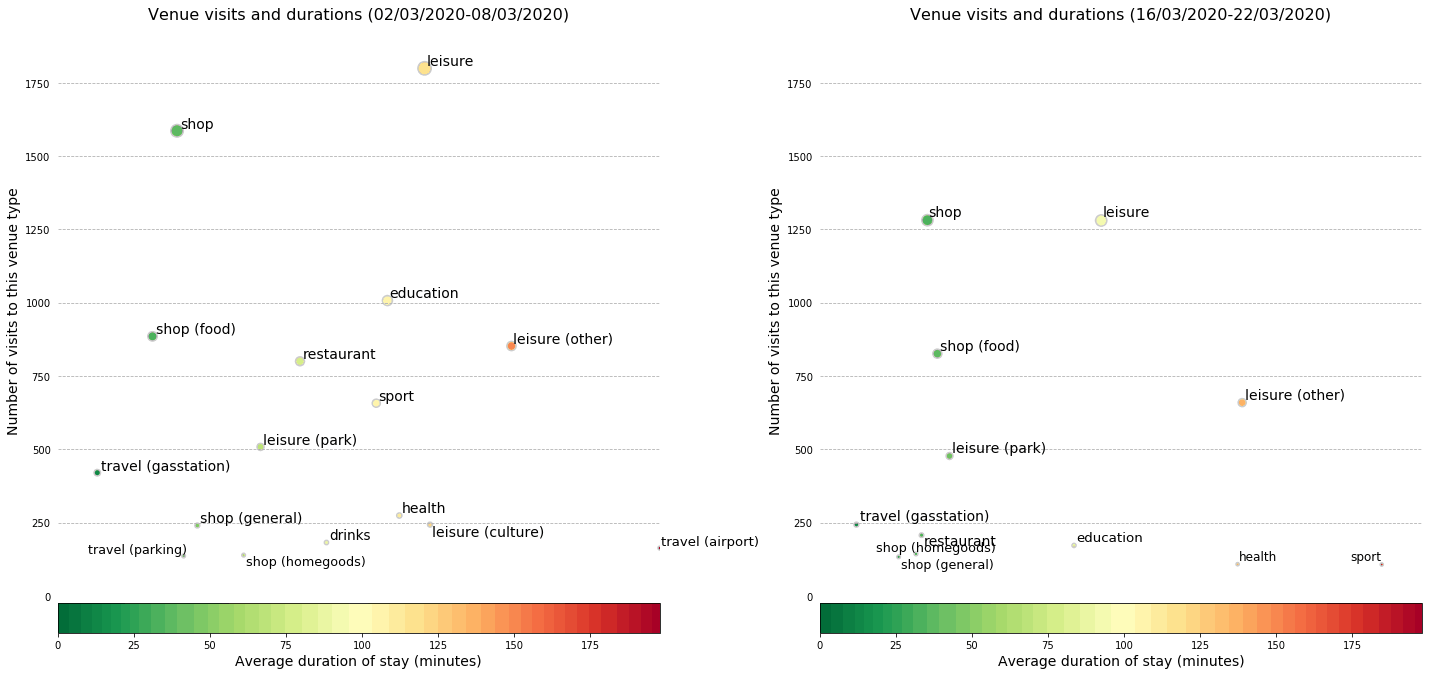
It’s clear that overall, the number of visits to places away from home went down across the board. However, this decrease is much more significant for some venue types, such as ‘education’ and ‘sport’ than for others, such as ‘shop (food)’ and ‘leisure (park)’. Apart from a decreased number of visits, we also see a decreased average duration of stay for most venue types, except for ‘sport’ locations and ‘health’ related venues.
[table id=2 /]
Based on the different changes for different venue types, we could wonder whether people with a specific lifestyle (e.g. sportive users) adhere better or worse to the imposed social distancing measures than users with a different lifestyle. Below, we show the percentage of time that users were not at home during the past two weeks, grouped by their lifestyle segments as inferred by our AI engine.
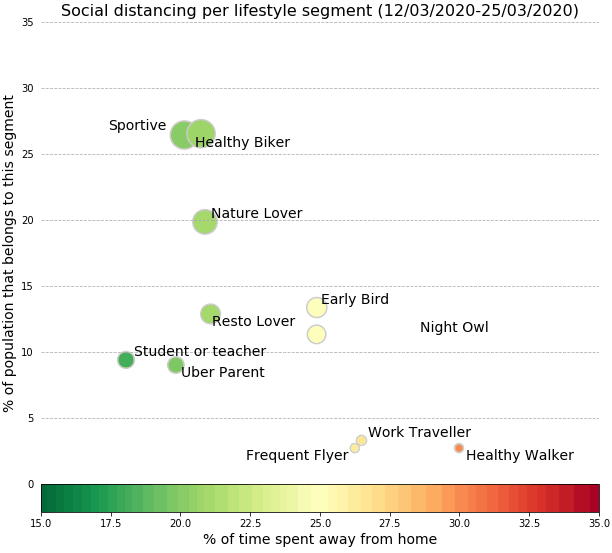
The vertical axis of this chart shows the percentage of the population which this segment was assigned to. Partitioning based on lifestyle allows us to identify potential vulnerabilities in today’s social distancing approach. For example, work travelers, which are usually businesspeople or sales representatives, still spend quite some time away from home and represent a non-negligible part of the population. On the other hand, both students and parents seem to set the right example, and mostly stay at home.
Ecological benefits of social distancing: The silver lining
Over 25000 users – 5000 of which were active in the past 2 weeks – monitor reduce and compensate their ecological footprint with the free For Good app. 50% of the 25000 For Good users lives in Belgium and the other 50% is spread over 60 other countries. The app monitors the CO2-impact of a user’s movements (walking, cycling, driving, public transport, flying, …), what the user consumes (food and beverages), and its energy consumption (heating and electricity at home). The data generated by the For Good community gives a good image of the ecological impact of the social distancing measures.
Naturally the social distancing measures leads to a decrease in kilometers traveled by car and by plane, resulting in a significant drop in CO2-emissions. The total CO2 impact (transport, food, energy) of the average user decreased in Belgium, The Netherlands, France, etc. This is illustrated below, where we show the average per-user CO2 emission due to mobility per week and per country in KgCO2.
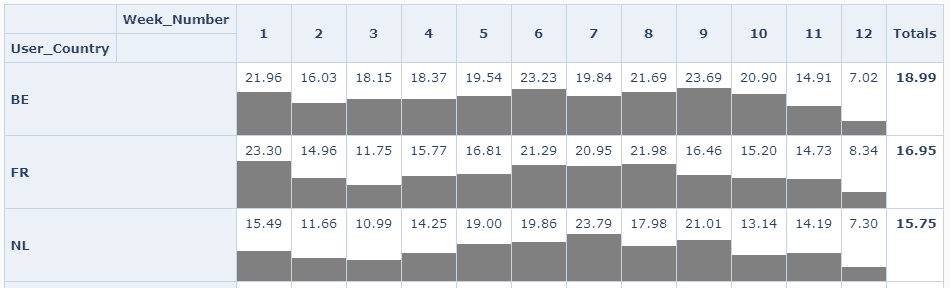
This shows a reduction in mobility induced CO2 emission of 15% in Belgium from week 8 (February 17-23), which is the week before spring break started, and week 12 (March 16-22).
The CO2 impact of food and energy consumption is almost stable with a slight increase in energy use. Nevertheless, the CO2 impact of the 5000 For Good users overall decreases with a significant 15 to 20% with positive consequences for air quality, our health, and the ecosystem. If 20% of the Belgian population reduces its footprint by 20% we increase our chances to reach our climate goals.
We measured a steep drop in car use in Belgium, France, and the Netherlands and in Italy we see on almost complete stand-still. Motorized vehicle use starts decreasing in week 11 until 50% in week 12. The use of public transport stopped almost completely in week 12.
Despite the measures Belgians and Dutch users keep walking and cycling, but users in our test population from France and Italy people are hardly walking. In France, the number of walking trips drop significantly right after President Macron’s speech (March 12).
We are aware this is of course a very exceptional situation and when social distancing measures are suspended, behavior will change again, with more trips by car and airplane for example, but hopefully this crisis taught us to use different forms of working and moving around. New habits will emerge that benefit our health and the health of our planet.


