
Introduction
The covid-19 pandemic continues to boost the growth of the telematics market which was expected to grow at a CAGR of 20.6% between 2021 and 20261,2. Smartphone-based solutions are expected to dominate the market as they help to launch usage-based insurance (UBI) programs at scale with lower costs2.
Now, this all sounds wonderful, but just like any technology at the cusp of a breakthrough, there could be some skepticism around its effectiveness. Many, particularly in the auto insurance industry question the quality of the collected data behind UBI, and more importantly, whether the identified driving events can be correlated to the statistical insurance risks (e.g. claims data).
Looking to answer such burning questions, we worked with our partner RISK, a leading InsurTech MGA and Distributor of Financial Products, and with their client FBTO, a label of Achmea, one of the biggest insurance companies in the Netherlands.
About the study
With users’ consent, we collected smartphone accelerometer and GPS data to build driver scores and evaluate driving behaviors. In this study, we showcase how FBTO uses Sentiance driver scoring to motivate its app users to become better drivers. Moreover, we show the correlation between those driver scores and claims data, and their relationship with faulty claims.
Let’s take a closer look ?
Unfair pricing of traditional risk models
Insurance companies use risk models to calculate insurance premiums. These models are highly dependent on user demographics. They tend to charge young people more because they are inexperienced drivers, but also because they interact with their phones more while driving.
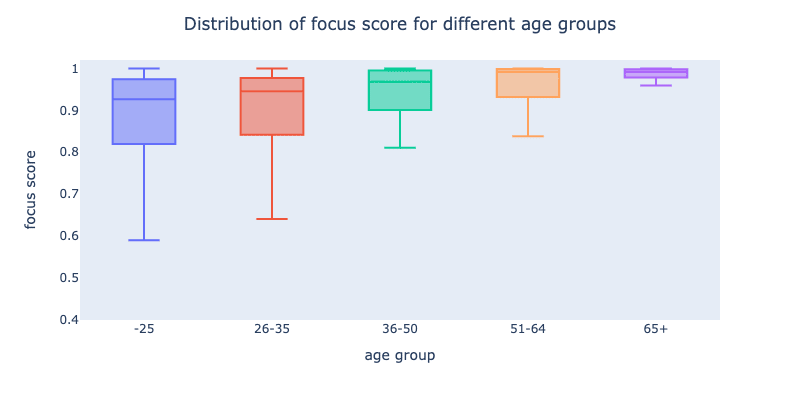
A higher score indicates less distraction.
We validated these general assumptions of the risk models with the data from the users. The distribution of the focus (distraction) score for different age groups shows that young people use their phones more and possess a higher risk. Hence, it’s expected for risk models to charge young drivers more to achieve the highest accuracy with minimal data at hand. There you have it, case closed…well, not quite.
The high variance within the focus scores of the age groups should be taken into account as well. This means good drivers in young age groups are being penalized by the general behavior of their age group. Today, we have enough data to do a better categorization than this. With telematics, it’s possible to assess individuals instead of categorizing them based on the behaviors of the general population.
An incentive program and its impact on safer driving
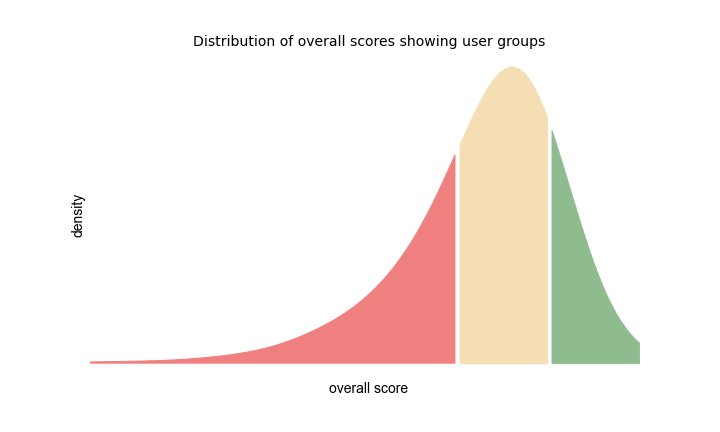
Having used Sentiance’s driver scoring since 2019 to reward customers with good driving habits, FBTO introduced an incentive program for customers to get discounts based on 3 user groups, color-coded as red, orange, and green. Each group indicates the level of reward offered; higher discounts for better driving scores.
The idea is to encourage customers to drive better and safer to benefit from insurance offerings with cheaper premiums. It’s a win-win campaign where loss ratios will decrease for FBTO and customers will pay less; making policies more affordable for safe drivers. In addition to that, it’s a big step toward safer roads, see for yourself ??
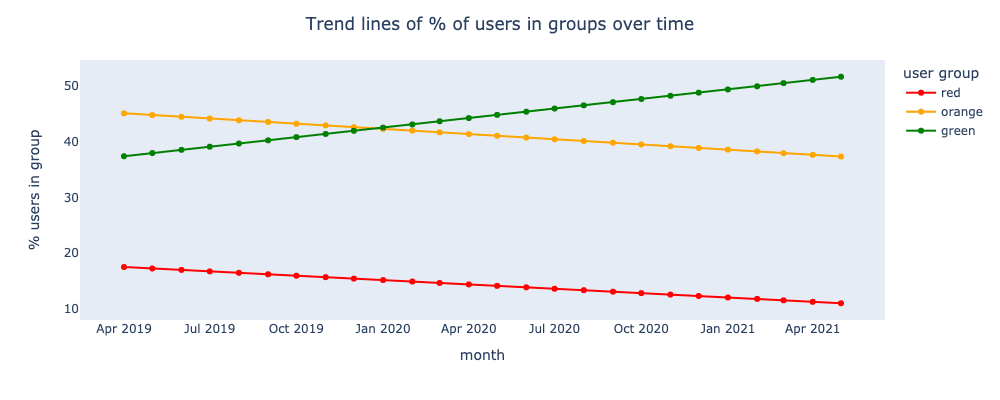
We saw that users strive to drive better for higher discounts. The campaign triggered an uptrend for the percentage of users in the green group, and a downtrend for the orange and red groups; meaning higher scores. The figure above displays those trends over the months with linear trend lines, all thanks to the driver scoring ??
So…Do higher driver scores actually mean better drivers?
To answer this question, we analyzed the claim requests that FBTO received for the same 2-year period. The claims dataset contains enough information (User ID, Date of occurrence, Cost of damage, fault) to relate driving scores to insurance claims with statistical analysis.
The Sentiance driver scoring outputs various driving score types. For the sake of simplicity, we stick with the overall score which is a combination of three driving risk aspects; aggressive driving, speeding, and distraction due to phone usage.
The insurer only pays out for at-fault insurance claims when damage includes two parties. A correlation exists between overall scores and loss ratios if users with an "At-fault" claim have a lower overall score compared to users with a “No-fault” claim.
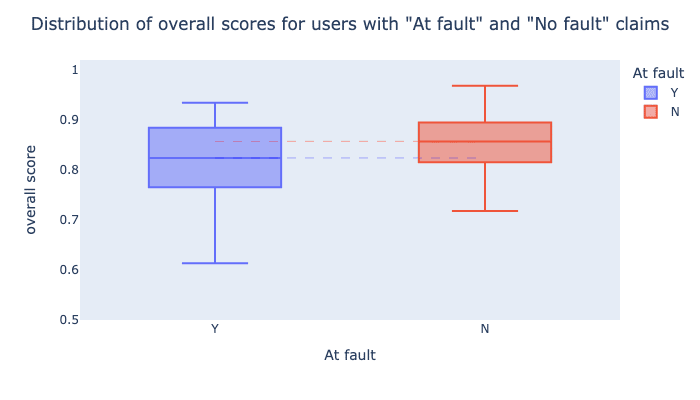
The distributions that can be seen in the figure above suggest such a correlation, and statistical tests prove that there is enough evidence to make that conclusion. Applying a t-test (statistical hypothesis test) can help us make sure these observations did not happen by chance. It tells us how significant the difference is between the mean overall scores of the two samples. The t-test that we did with a 95% confidence interval suggests there is enough evidence to conclude that users with an "At-fault" claim have a significantly lower overall score compared to users with a “No-fault” claim.
Out with the old, in with the new
In this digital age, we believe that traditional risk models are no longer sufficient. Sentiance driver scoring allows people to get fair pricing based on how they drive instead of getting categorized based on the behavior of others. In this study, we show that people drive safer when they are incentivized by their insurance provider, allowing the provider to have a more competitive offering. Moreover, we statistically proved that on average higher Sentiance scores mean having a lower chance for a customer to submit a claim At-fault.
This is also mentioned by Tony Dingemanse, Director Ventures & Projects of RISK.
“Insurers should make use of individual and personalized data to determine their risk, reward better drivers and improve their claims portfolio. Especially, with our partnership with Sentiance, we are able to detect if a user is distracted by his phone while driving.”
Sources:
(1) Consumer Intelligence
(2) Mordor Intelligence
Give us a shout and together let’s discover how you can improve and personalize your offering to users, all while positively contributing to safer roads. In the meantime download our flyer below??


