
Introduction
In "Predictions 2016: The Mobile Revolution Accelerates", Forrester forecasted that by the end of 2016 more than 25% of companies will consider mobile not as a channel, but as a fully integrated part of their overall strategy. Moreover, the research firm expects customer-focused companies to take personalization to the next level by extracting relevant moments from customer data using intelligent data processing techniques:
"To serve customers in context where they already are – not where brands find it convenient to serve them, firms must look to use context both to assemble and deliver experiences dynamically"
Mid 2016 we are already seeing how the mobile giants start facilitating this process; Google recently announced its Awareness API to bring contextual features directly to Android developers, whereas Apple is preparing a Siri SDK that will allow IOS developers to directly tap into the IPhone's personalized intelligence framework.
At Sentiance we believe context awareness should be taken even further. In "6 reasons why Context is the new king in marketing land" our Chief Business Development Officer, Tom Vandendooren, explained the importance of addressing each of the 6 Ws of context: Who-What-Where-When-How-Why. Although location (Where) and activity detection (What) enable some degree of hyper-targeting, without knowing the user's complete context including his intent and personality profile, your message may still lack relevance.
To help customers deliver the right message to the right person, at the right moment and place, we launched our Ambient Intelligence platform (and Android/IOS SDK) in April 2015, containing machine learning algorithms that automatically learn to understand and predict your customer's behavior by connecting his actions with the relevant context. In the next few paragraphs we will dive into the technicalities of our platform, and try to explain how our algorithms model and combine behavior, environment, actions and interactions, prior knowledge, predictions and intent.
Contextual flow
Modelling the 6Ws (Who-What-Where-When-How-Why) that represent a user's context required us to develop a hierarchical pipeline, where mobile sensor data is ingested at the lowest level and a complete user profile is emitted at the highest level. Intermediate steps translate sensor data into events and events into moments as illustrated by figure 1.

Figure 1. At Sentiance, we define context as the combination of current, previous and predicted events, moments and profile segments.
The arrows pointing from profiles to moments and events indicate our ability to tailor our algorithms to a specific user. Including both moments and profiles into the definition of context is imperative if we want to detect intent.
For example, a sportive person (Who) who is running (How) in the city (Where) on a Saturday afternoon (When) most likely has a different intent than a non-sportive weekend worker who is running to catch the bus.
Moreover, a user's profile can often serve as prior knowledge when trying to detect an event from noisy sensor data. For example, if a classifier is unsure whether a user is currently in a train or in a car, the user's segments (e.g. hard-core driver, long-commuter) allows the classifier to bias its decision process based on the user's past and hence expected behavior.
The difference between events, moments and profiles is illustrated more clearly in figure 2 by means of a context pyramid:
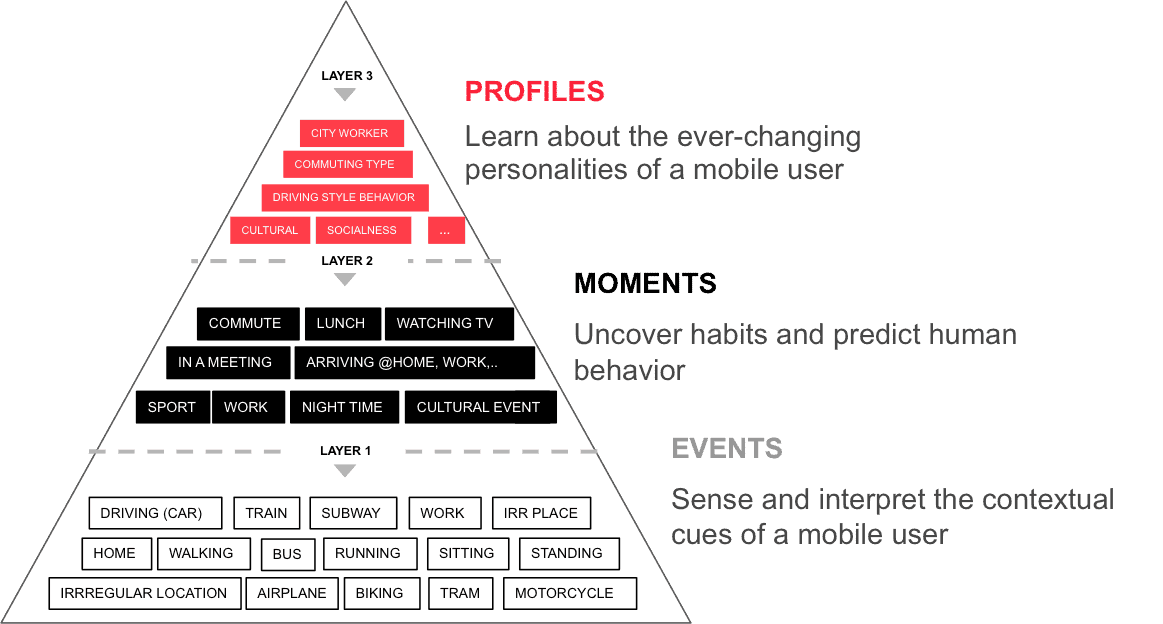
Figure 2. Our hierarchical system distills sensor data into events (layer 1), events into moments (layer 2), and moments into segments (layer 3). Each layer represents a longer aggregation over time of data coming from the previous layer.
Whereas traditional context aware solutions tend to focus on the first level of the context pyramid, our solution augments these events with intelligent 'layer-2' moments and 'layer-3' profiles. In the next paragraphs, we will dig deeper in each of the components of our context pipeline.
Sensor data
Although declared data such as Facebook messages or calendar schedules can be extremely useful when trying to determine someone's context, we believe in the higher accuracy of non-declared and observed data to be used for contextualization of mobile applications or environment discovery. To avoid privacy issues, we therefore deliberately focus on using AI to get the most out of only four low-level sensors available in today's smartphones:
- Time/day
- Location subsystem
- Accelerometer
- Gyroscope
Time/day and the location subsystem obviously serve as the most important data points to answer the 'When' and 'Where' parts of the user's context. However, even time/day and location need to be personalized in an intelligent manner before they can be used to describe a person's context. To a night worker, 09h00 AM has a different meaning than it has to a part-time day worker. Similarly, two persons that are on a similar geographical location could - given the inaccuracy of GPS - be visiting different nearby places, depending on their general routines and behavior.
Accelerometer and gyroscope sensors are extremely sensitive sensors that measure vibrations and motion of a smartphone. These sensors are used by the OS to automatically turn the screen when a user rotates the device, but could be used for much more. At Sentiance, we designed a set of highly accurate classifiers, that are able to distinguish different types of smartphone vibrations. For example, we can distinguish vibrations caused by a car's engine from those caused by a train engine or by a user that is handling the smartphone. Accelerometer and gyroscope sensors therefore help us answer the 'How' and 'What' parts of the user's context.
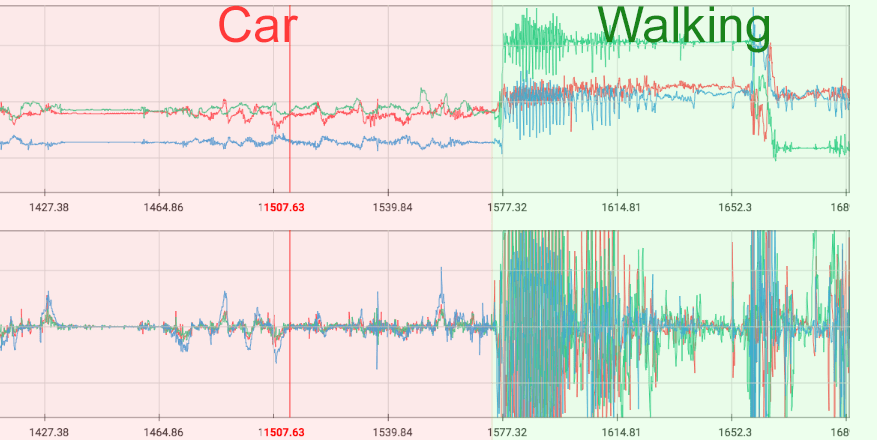
Figure 3. Accelerometer (top) and gyroscope (bottom) data, sampled at 26Hz from a transport session consisting of a car segment and a walking segment.
The Sentiance SDK, once incorporated into our customer's app, starts monitoring these sensors in a background process, without the need for the app to be running in the foreground. The SDK dynamically chooses which sensors are the most important to query at each time instant, continuously incorporating battery usage estimates into its decision process. For example, location fixes are only requested from the OS once every minute when a user is moving, and sensor data gathering is halted completely when the user is idle.
This allows us to model a user's complete day-to-day journey, without significantly reducing battery life. On the other hand, it requires some sophisticated algorithms that are running on our backend to actually turn this low-frequency, sparse data into contexts, predictions, profiles and insights.
Events
Although an in-depth discussion of all the events we currently detect would lead us too far, it might be worthwhile to briefly describe our detection process for four important event types:
- Transport mode
- Car, walking, biking, running, train, tram, bus, airplane, idle
- Places
- Home, work, POI, regular, non-regular, new
- Venues
- E.g. shop, education, gas station, office, entertainment,
food, geo, leisure, conference, culture, airport, health,
public transport, parking, sport, tourism, drinks, etc. - Semantic time
- Morning, lunch, afternoon, evening, night
Each of these event types are briefly touched in the following paragraphs.
1) Transport mode
Both IOS and Android come with an on-board activity classifier. However, at the time of writing, both systems can only detect running, walking, biking and in vehicle activities, and don't distinguish between different vehicle transport modes such as train, bus and tram.
Moreover, the accuracy of the built-in classifiers is too low for high-end contextualization purposes. For example, biking sessions are often incorrectly detected as a sequence of walking-idle-biking segments on lower-end devices, whereas train sessions are often confused with idle sessions due to the low vibration magnitude of modern train gears.
We therefore designed our own opportunistic transport mode classification pipeline, where 'opportunistic' refers to the fact that our machine learning models are able to take into account whatever combination of data is available (accelerometer, gyroscope, motion activities, location). This again allows for graceful degradation on low-end devices, and enables our SDK to only query those sensors that really matter in each specific context.
We gathered sensor data for thousands of trips, for which we manually labelled each second of data to train and test our classifiers. The transport mode classification pipeline consists of four building blocks, each of which were tested using cross-validation:

Figure 4. Our opportunistic transport mode classification pipeline is able to cope with missing data, and learns to detect temporal patterns that are specific to each transport mode.
- Location-only classification: Random forest classifier
- Sensor-only classification: Random forest classifier
- Temporal classification: Dynamic Bayesian Network classifier
- Temporal smoothing: Hidden Markov Model smoother
Short-term temporal patterns are detected by the random forest classifier by feeding in features that describe the signal in both the temporal domain and the frequency domain. Long-term temporal patterns are learned by the Dynamic Bayesian network classifier, which is a generative model that allows us to cope with missing data such as location fixes which are not always available.
Before feeding the sensor data into the classifier, advanced signal processing techniques are used to interpolate and resample the signals and to remove unwanted frequency components by means of band-pass filtering. A recursive Bayesian filter is used to perform sensor fusion in order to continuously estimate the phone's current orientation and to normalize the data. This is discussed in more depth in our previous blog post about 'Driving behavior modeling using smart phone sensor data'.
Finally, our probabilistic map matching algorithm reconstructs the most likely trajectory of the user, based on the limited set (i.e. at most one per minute) of inaccurate location fixes that are captured by the SDK as illustrated by figure 5.
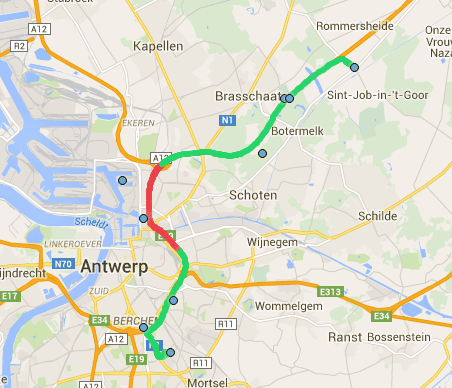
Figure 5. Our probabilistic map matching algorithm has been designed specifically to cope with low frequency, inaccurate location fixes. This allows us to sparsely query the mobile location subsystem, thus saving battery, while still being able to reconstruct the user's trajectory with great accuracy.
2) Places
An important step in our context detection pipeline is the estimation of a user's approximate home and work locations. A simple solution would be to consider places where the user generally spends the night as the home location, and other frequently visited places as the work location.

Figure 6. Our home/work detector is independent of a user's daily schedule and therefore also works fine for night-workers, shift-workers and part-time workers.
However, this would fail for many people that work at night or in different shifts, or for those that have multiple home or work locations. We therefore designed a classifier that is able to detect a user's home/work places without depending on actual time, resulting in a solution that works independently of the user's working schedule.
The first stage of our place-type classification pipeline clusters the user's stationary locations using a density based clustering approach. Each of these clusters are then described by a set of features such as their connectivity, frequency of visits, duration of visits, places nearby, etc.
A binary linear support vector machine classifier then divides these clusters into 'home/work candidates' and other clusters. This classifier is trained by manually labeling a large data set, obtained by a test population. The resulting home/work candidates are then further clustered in an unsupervised manner in order to distinguish possible home candidates from possible work candidates. Finally, a rule based step removes unlikely candidates.
A side product of this process, is that it allows us to easily detect other place types such as 'regularly visited locations', 'non-regular locations', 'POIs' (i.e. home/work like locations that are not truly a home or work location) and 'new locations'. Moreover, our social graph detection algorithm -not discussed in this blog post- allows us to compare clusters of related people in order to detect family members, friends, co-workers and customers based on the output of this pipeline.
3) Venues
An important factor in determining a user's context when the user is stationary, is venue mapping. Venue mapping means finding the most likely place, such as a shop or restaurant, the user was visiting.
Locations, expressed as (latitude, longitude) pairs, are obtained from the mobile OS and accompanied by an accuracy estimate in meters. The OS performs sensor fusion by combining GPS with WIFI and cell tower fingerprints to obtain the most accurate location estimate.
Most solutions on the market simply query a GIS database such as Foursquare or Google Places, to fetch the venue that is the closest to the user's current location. However, due to the inherent inaccuracy of indoor GPS, and due to errors introduced by the sensor fusion process, the user's actual location is often quite far from his observed location.
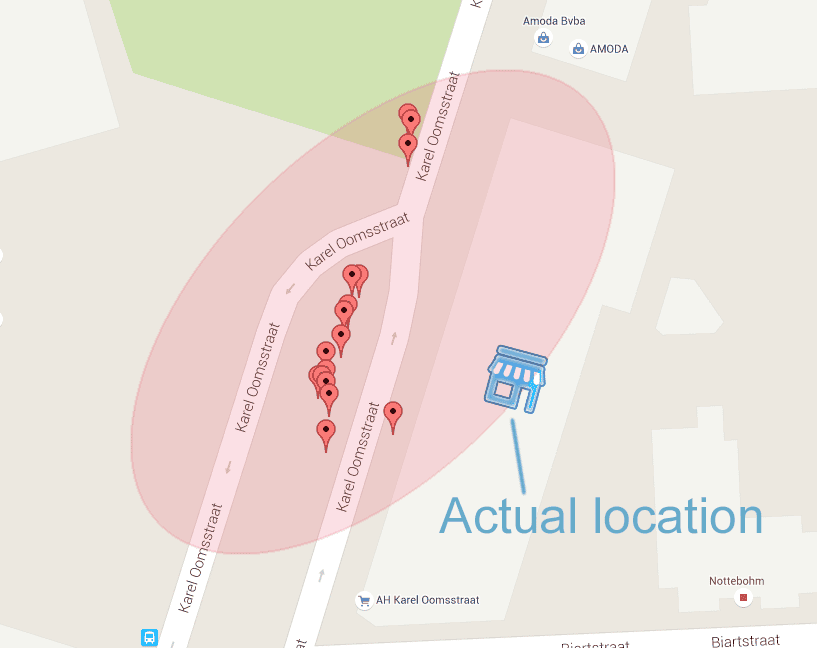
Figure 7. This figure shows a set of stationary locations that were observed over several weeks of data when visiting a shop. The 95% confidence interval is represented by the shaded ellipsoid.
This figure illustrate that observed locations are often far away from the user's actual location, due to GPS inaccuracies and sensor fusion issues.
Simply picking the closest or most popular venue in the user's neighborhood would therefore seldom yield the correct result. To overcome this, we split up the venue mapping process in two independent stages:
- Venue type matching
- Venue location matching
Venue type matching refers to assigning a probability to each venue type. Venue types are, amongst others, restaurants, shops, offices and drinks. Given a set of features, such as the user's profile, previous context, time of day and day of week, average duration spent at this venue and number of visits, we trained a classifier to estimate the probability of the user being in each one of these venue types, irrespective of their occurrence within the user's current surroundings.
The venue type probabilities then allow us to bias the distance measure used during venue location matching. The location accuracy, as returned by the mobile OS, is expressed as a one-standard-deviation from the current location. This makes it easy to calculate a likelihood value for each venue location assuming the underlying distribution of the observed location is of Gaussian shape. Combining this likelihood value with the probability obtained during venue type matching is accomplished by means of a Bayesian network framework.
This approach allows us to assign a venue type to the user's current context, even when no actual venue can be found in our GIS database, currently comprised of a combination of Foursquare data, Openstreetmap data and Google Places data.
4) Semantic time
The last event type we will discuss in this article, is semantic time. Semantic time differs from calendar time, in that it is specific to each user. One user’s semantic morning might start at 08h00 AM, whereas another user’s semantic morning might start at 07h30 AM. Moreover, a person who works at night and sleeps during the day could have a semantic morning that starts at 23h00 in the evening. Semantic time thus corresponds to a user’s biological clock, and depends on his lifestyle. The concept of semantic time helps us to cope with various behavioral patterns (e.g. night workers versus day workers), and allows our customers to target their user segments at the right time, in the right place and context.
The need for accurate semantic time detection is the main reason that we had to design a home/work classifier that is independent of calendar time, i.e. that works as well for night workers as it does for day workers. By sliding a 24-hour window over a user's timeline, we can now easily determine the longest time period the user was at home and assume that somewhere within this time period the user was actually sleeping. Similarly, we can determine the time period during which the user was actually working and the time period during which the user was likely having lunch.
Given these time periods, it then becomes trivial to detect the first activity (i.e. transport) after, and the last activity before each of these time periods. These activities are what we call semantic anchor points.
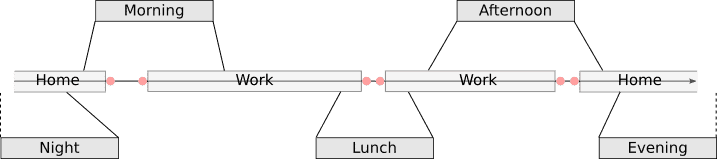
Figure 8. Calendar time is mapped to semantic time by dynamically warping the anchor points (shown in pink) to the expected daily schedule. Anchor points are calculated over the complete timeline of a user, and are allowed to be missing or undetectable in certain cases.
If we can detect enough of these anchor points over time, then detecting the semantic schedule of a user can be formulated as an optimization problem, where we want to minimize the average distance between the anchor points and a normal timeline consisting of [morning, lunch, afternoon, evening, night]. This is illustrated by figure 8.
Moments
Although many solutions on the market today directly tie events to context, we believe that events only become relevant when they can be mapped to intent. This means that mobile events need to be translated into meaningful moments, reflecting real-life and real-time context and routines.
For example, a sequence of events such as [walking, shop, walking, shop, walking, coffee shop, walking] become interesting only when we assign it a label such as 'afternoon shopping'. Moreover, if we know that the user goes shopping almost every Saturday afternoon, we can further augment the moment definition as 'afternoon shopping routine'.
Another interesting example would be the event sequence [home, running]. 'Running' itself is merely an event without much meaning. While one user might be in his weekly sporting routine, another might just be running to catch the bus when he is late for work. However, to put this sequence of events in context, we need to be able to predict the next most likely event which might for instance be 'at work'.
Thus, a moment is a short-term aggregation of recent events, combined with predictions that model the user's expected behavior. In order to model a user's expected behavior, we implemented a Markov model that calculates the probability of a given moment for a specific user, given his previous event, the time of day, and the day of the week. This model is trained in a user-specific manner, based on a user's recent history.
The following video shows this probability for one of the Sentiance employees on a Monday, assuming that the previous event in the user's timeline was 'walking':
Based on the predictions, we can now turn real-time events into moments. Note that not all moments are mutually exclusive. For example, the video at time 08h40 shows that it is possible for a user to be in his morning commute and in a shop at the same time, for example when the user decides to quickly buy a sandwich on his way to work.
Since multiple moments can be active at the same time, and we still want to preserve a sense of ordering, moments are placed on a time varying stack. The top element of this stack always contains the latest active moment, whereas digging deeper in the stack reveals other relevant moments that are currently active, as illustrated by figure 9.
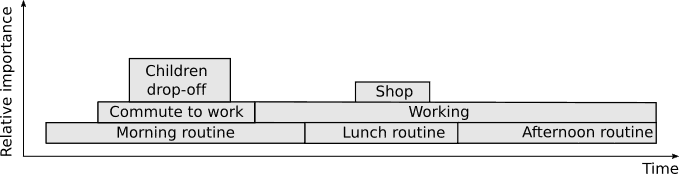
Figure 9. Moments are stored in a time varying stack data structure. At each point in time, the most recent active moment is the top element of the stack, while digging deeper reveals moments that started earlier and did not end yet. Mutual exclusive moments that connect to each other, such as morning routine and lunch routine, maintain their original stack index.
Some of the more interesting moments we currently detect in real-time are:
- Working at work
- Working at remote
- Being at home
- Commute to work
- Commute to home
- Shopping routine
- Sporting routine
- Restaurant routine
- Shopping (outside of the user's routine)
- Sporting (outside of the user's routine)
- Restaurant (outside of the user's routine)
- Traveling
- Business trip
- Dropping off children
Combining these moments with the events that caused them and with the general profile of the user, gives our customers the opportunity to communicate with their users in a hyper-targeted manner.
Profiles
Apart from the dynamic moments stack, discussed in the previous paragraph, we also reconstruct the user's timeline based on the mobile events themselves, as shown in figure 10.
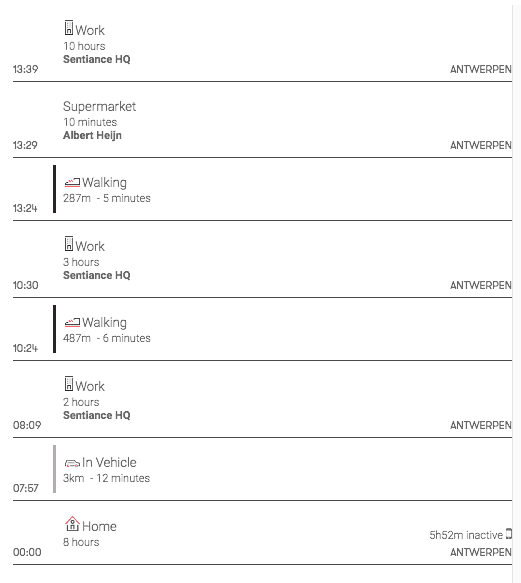
Figure 10. Events are stitched together to represent the user's daily journey. The combination of the event timeline and the dynamic context stack then enables us to detect patterns and to model user similarity in order to segment the audience into meaningful clusters.
This timeline, in combination with the dynamic moments stack, allows us to define user segments by clustering users into related groups. Example segments are for instance 'workaholics' and 'green commuters'. The complete set of segments a user belongs to makes up his profile.
Finally, the combination of current events, active moments and the user's profile, defines what we call context! Today, we automatically assign the following segments to each of our users:
- Work/lifestyle segments
- City home, City worker, Early bird, Homeworker, Night worker, Rural home, Rural worker, Shopaholic, Town home, Town worker, Workaholic, Work traveler, Full-time worker, Part-time worker, Student/Teacher, Uber parent
- Geography segments
- Lives in , Works in
- Affinity segments
- Brand loyalty, Brand loyalty: Gas stations, Brand loyalty: Supermarket, Clubber, Culture buff, Dog walker, Quality home time spender, Resto-lover, Sportive
- Mobility segments
- Die Hard Driver, Easy commute, Green commuter, Heavy commuter, Long commute, Normal commuter, Short Commuter
- Driver segments
- Aggressive driver, Anticipative driver, Efficient driver, Illegal driver, Legal driver
Segments are discovered and defined in three ways:
- Rule based (as requested by a customer)
- Similarity based (find all users that is similar to a given user)
- Clustering based (unsupervised learning/datamining)
Rule-based segmentation can be based on any combination of behavioral attributes, patterns and routines, and as such has endless possibilities of dynamically defined behavioral and lifestyle segments. We carefully define and validate these segments together with our customers depending on their business and use case.
Unsupervised detection of segments is achieved by means of factorization techniques such as Latent Dirichlet Allocation, which originated from the Natural Language Processing community. Each user's timeline and moments stack is summarized by hundreds of statistics which we refer to as attributes. Examples of attributes are 'number of working hours per week' or 'percentage of transports spent in car'.
These attributes define the user's general behavior and can serve as features for a clustering algorithm. Due to the large amount of attributes, and their sparse nature (lots of zeros), matrix factorization and collaborative filtering techniques are perfect candidates for unsupervised data mining.

Latent Semantic Analysis applied to the timelines of small test population. Several venue types have also been mapped to this latent space, to allow for easier interpretation. Several distinct clusters appear, showing users that have very similar temporal behavior.
Privacy
Given the possibilities and functionalities discussed above that are derived from collecting personal data, it is imperative for Sentiance to uphold strict data protection standards to ensure adequate protection and privacy.
The regulatory framework for protecting personal information, ranging from your e-mail address to your sensor data, is an ongoing discussion among policymakers and is key to ensuring ones right for privacy or the implied freedom of unauthorized intrusion.
Since the decentralization of European privacy commissions based on the official Directive 95/48/EC, the European Commission has decided to unify basic standards of protection in its renewed General Data Protection Regulation (GDPR) coming in effect as per 25 May 2018.
The new standards will apply to both data controller and data processor who are both responsible to uphold the prescribed data measures. Since Sentiance is capable of deriving behavioral information by using its proprietary context detection and machine learning pipeline on only three simple sensors, it is imperative to protect and respect our customer’s privacy by ensuring adequate levels of security, both within the company and with our suppliers.
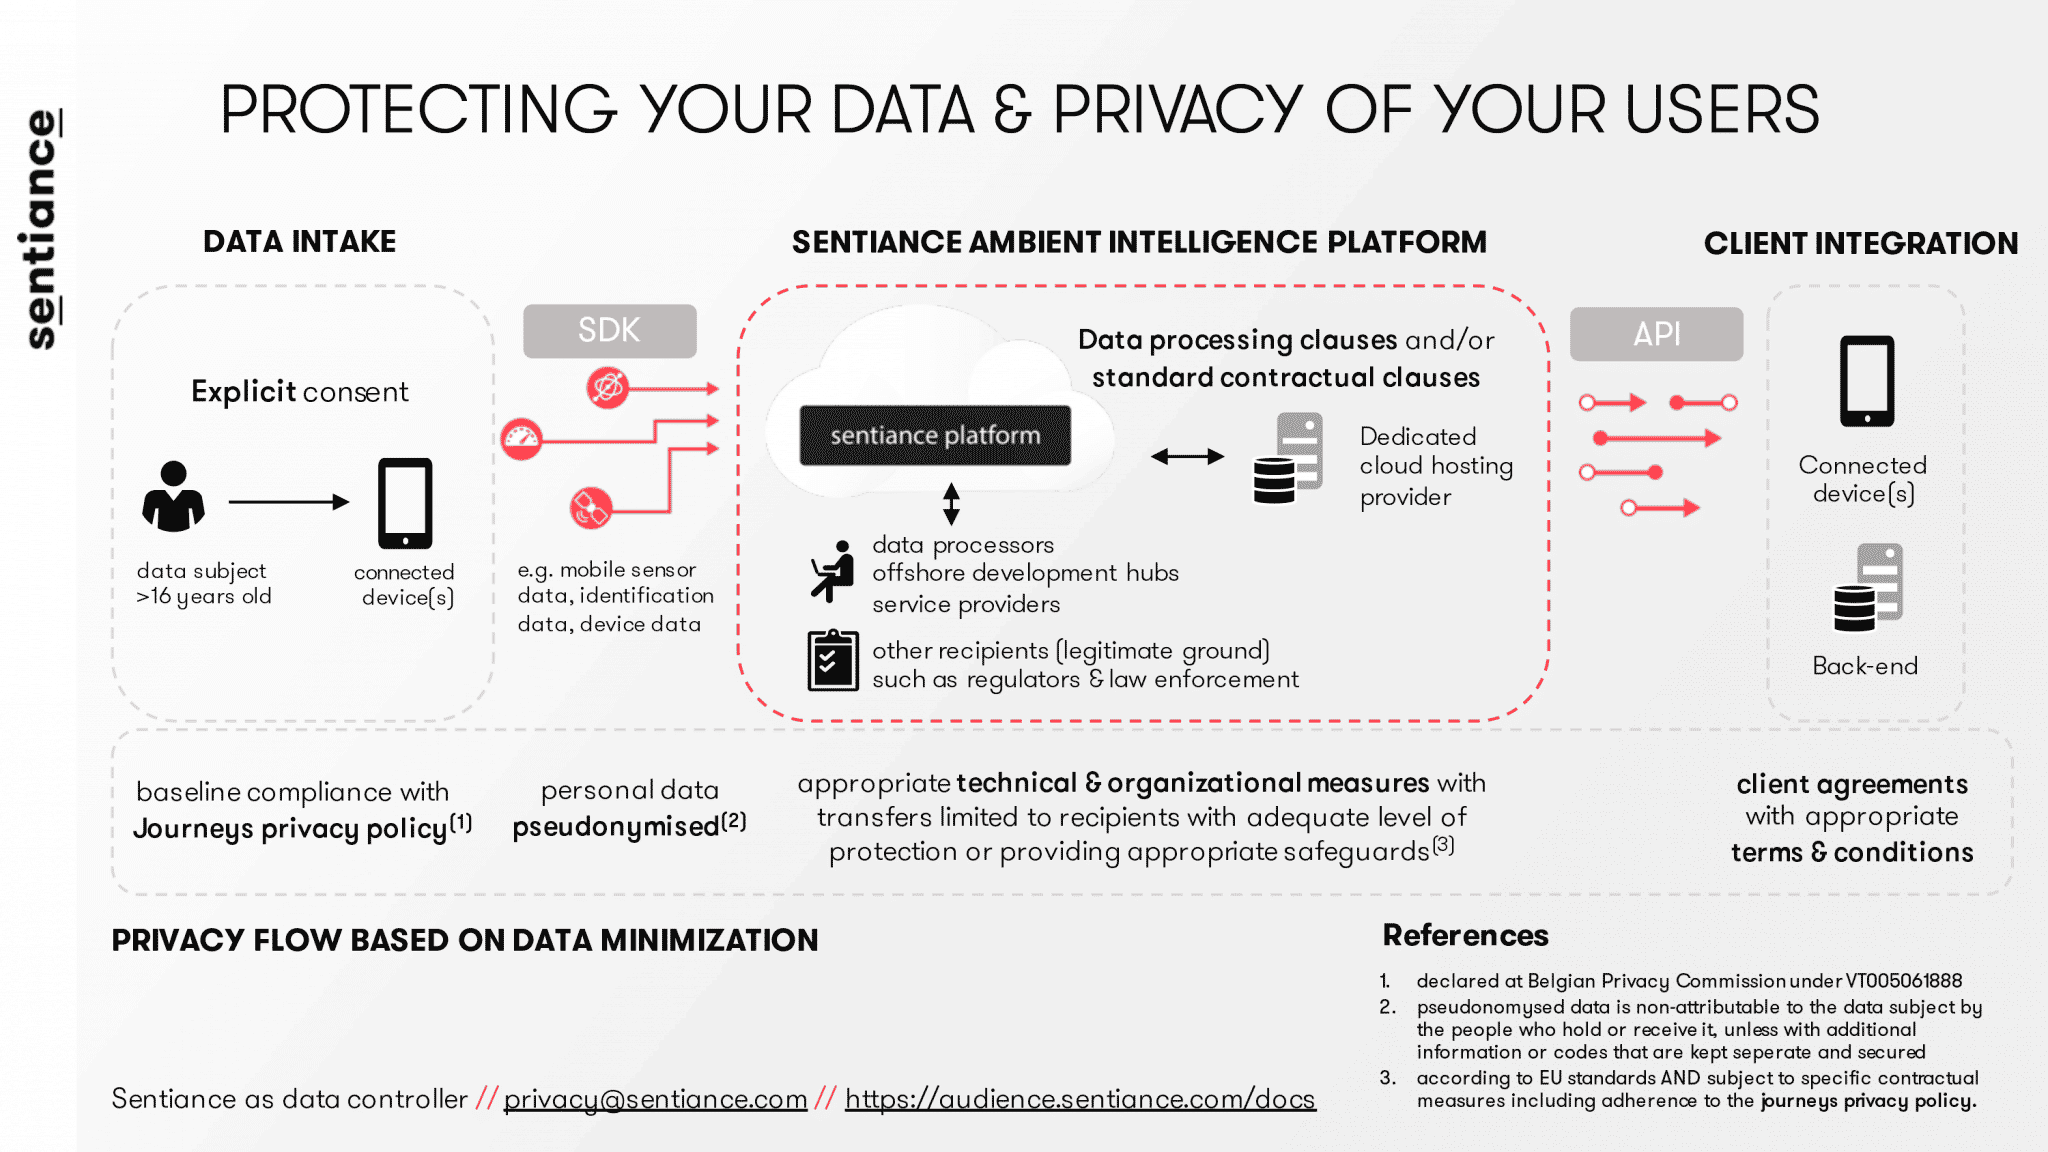
Sentiance ensures privacy based on three pillars:
- The Sentiance Ambient Intelligence platform is designed to protect data streams by safeguarding that all PII (personally identifiable information) is pseudonymised, meaning that personal data is processed in such a manner that it can no longer be attributed to an individual without the use of additional information, which Sentiance keeps separately and subject to technical and organizational measures. Sentiance therefore represents a single user by a random ID which is never augmented with personal information of any kind, such as an e-mail address.
- Customers that wish to work with the Sentiance SDK are suggested to uphold strict privacy standards as provided by Sentiance, formalize the measures in a clear privacy policy and adapt their application with an explicit opt-in and age confirmation of the end-user. This procedure is transparent for the end-user and clearly informs on the data that is gathered and its intended purpose. No data is collected that does not relate to the purpose, for which Sentiance abides by the concept of data minimization. In the event the end-user does not feel comfortable about the received value compared to the data exchange, the end-user is always able to decline the opt-in procedure.
- Sentiance has established technological and organizational measures to map all control systems, confidentiality agreements, data processors, service providers and other recipients to further provide assurance towards the dataflow.
Privacy is not grey, it is as important to show the value of your product as it is to provide insights in the use and purpose of the collected data. Sentiance does not sell the data of its customers, Sentiance (temporarily) uses sensor data that it receives via a mobile user that confirmed data collection via an opt-in functionality to build enriched profiles that map the customer journey and enables companies to unlock new levels of personalization.
Conclusion
In this article we described some of the inner workings of our context detection pipeline. We discussed why context should be represented by more than just time and location, and how context truly is more than the sum of all the situational and behavioral parts. It takes a talented cross-functional team to combine low level signal processing with state-of-the-art machine learning and to deploy all of this on a scalable system that can handle millions of requests in real-time.
Our mobile contextualization mission is far from over. We are working hard on improving our venue mapping algorithm, are discovering and defining new segments and moments on a daily base, are extending our predictive capabilities, and are adding some interesting health specific moments and insights.
Ready to contextualize your product, or you have an awesome use case where user-centric design is key? Download our demo app, Journeys, our mobile SDK, or contact us!


