


It’s the end of a long shift and a rider who has been with you since launch sends a message: “My score went from 91 to 86 this week. Same routes as always. What did I do?” If you run rider coaching at a delivery platform, you get this message most weeks. You can open the trips and sub-scores. What you cannot tell him is whether 86 is good, and where it puts him among the riders in his city. So the conversation becomes a defense of the number instead of coaching, and a rider who cannot read his score stops reading it.
What Safe Trip Rate is
Safe Trip Rate is a different way of reading the same trip scores. Instead of an average, the rider sees the share of his recent trips that met the safety standard. It reads in one look, it uses the same measure for a rider and for his city, and it spreads riders out so that your coaching list and your tiers are easier to act on.
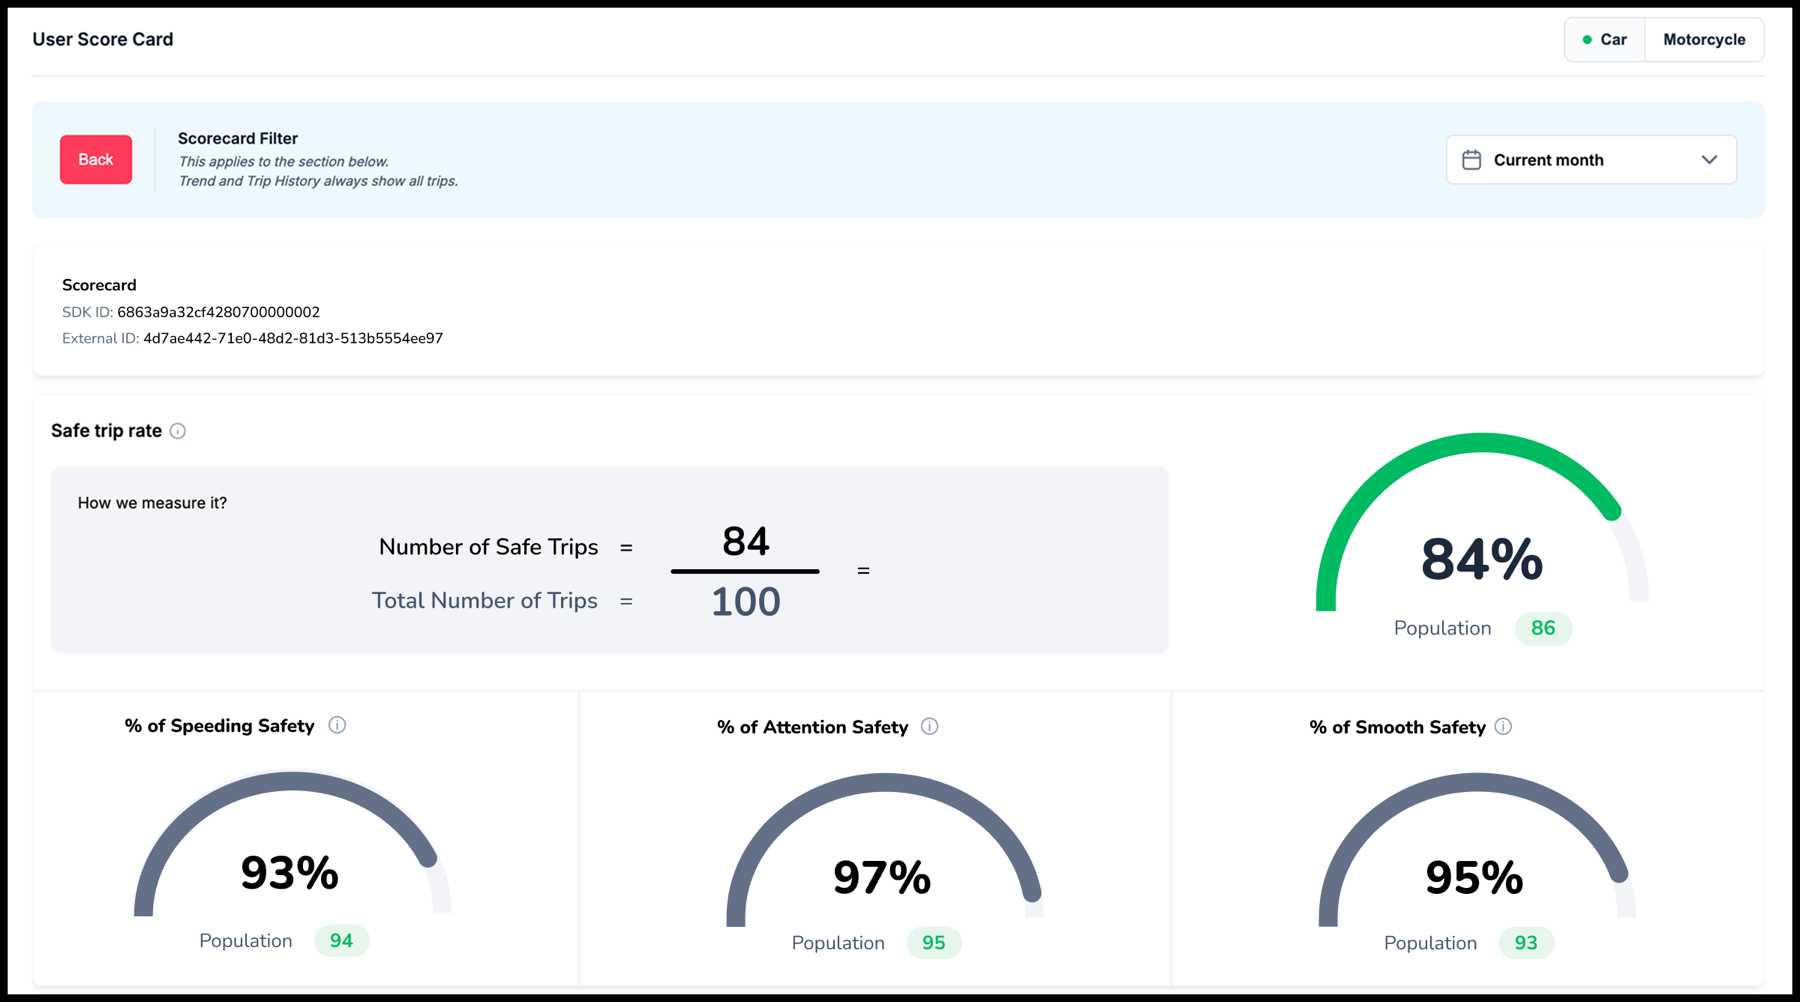
So instead of “86,” he sees “84% of your recent trips were safe.” Underneath, each behavior has its own rate, for example 92% of trips passed on speeding, 97% on smooth driving, and 82% on calls while moving. For the rider, the behavior with the lowest rate is the one to work on. For the team, the rider with the lowest Safe Trip Rate is the one to coach first. The trip scores underneath don’t change; what changes is the number the rider and the team read.
Why an averaged rider safety score reads higher than it should
Most trips on a shift are mostly fine, even for a rider who speeds often or brakes hard a few times a day. When you average his trip scores, the many fine trips pull the number up and the problem trips barely move it. A rider with real issues can still land on a number that looks acceptable, and the riders you’d want to recognize end up only a few points above him. Everyone sits high and close together, so the number tells a rider less than it seems to.
A share of safe trips behaves differently. A trip either met the standard or it didn’t, so a rider with issues on a third of his trips gets a rate that says so, and a rider with almost none gets a rate near the top. The spread between riders is wider, which is what makes tiers and coaching lists easier to act on. The rate also reads the same way at every level: for a rider, a cohort, a city, or a transport mode, over a day, a week, or a month. Like any rate, it needs enough trips behind it before it means much, which is why a rider’s rate is only shown once there are enough scored trips in the window.
What gets easier
For the rider. Two weeks later, the same rider opens his app and sees 81% of recent trips safe, with calls while moving at 79% and the other two rates in the nineties. He doesn’t need anyone to interpret it. He knows which behavior is pulling the rate down, and he can watch it move with every clean trip.
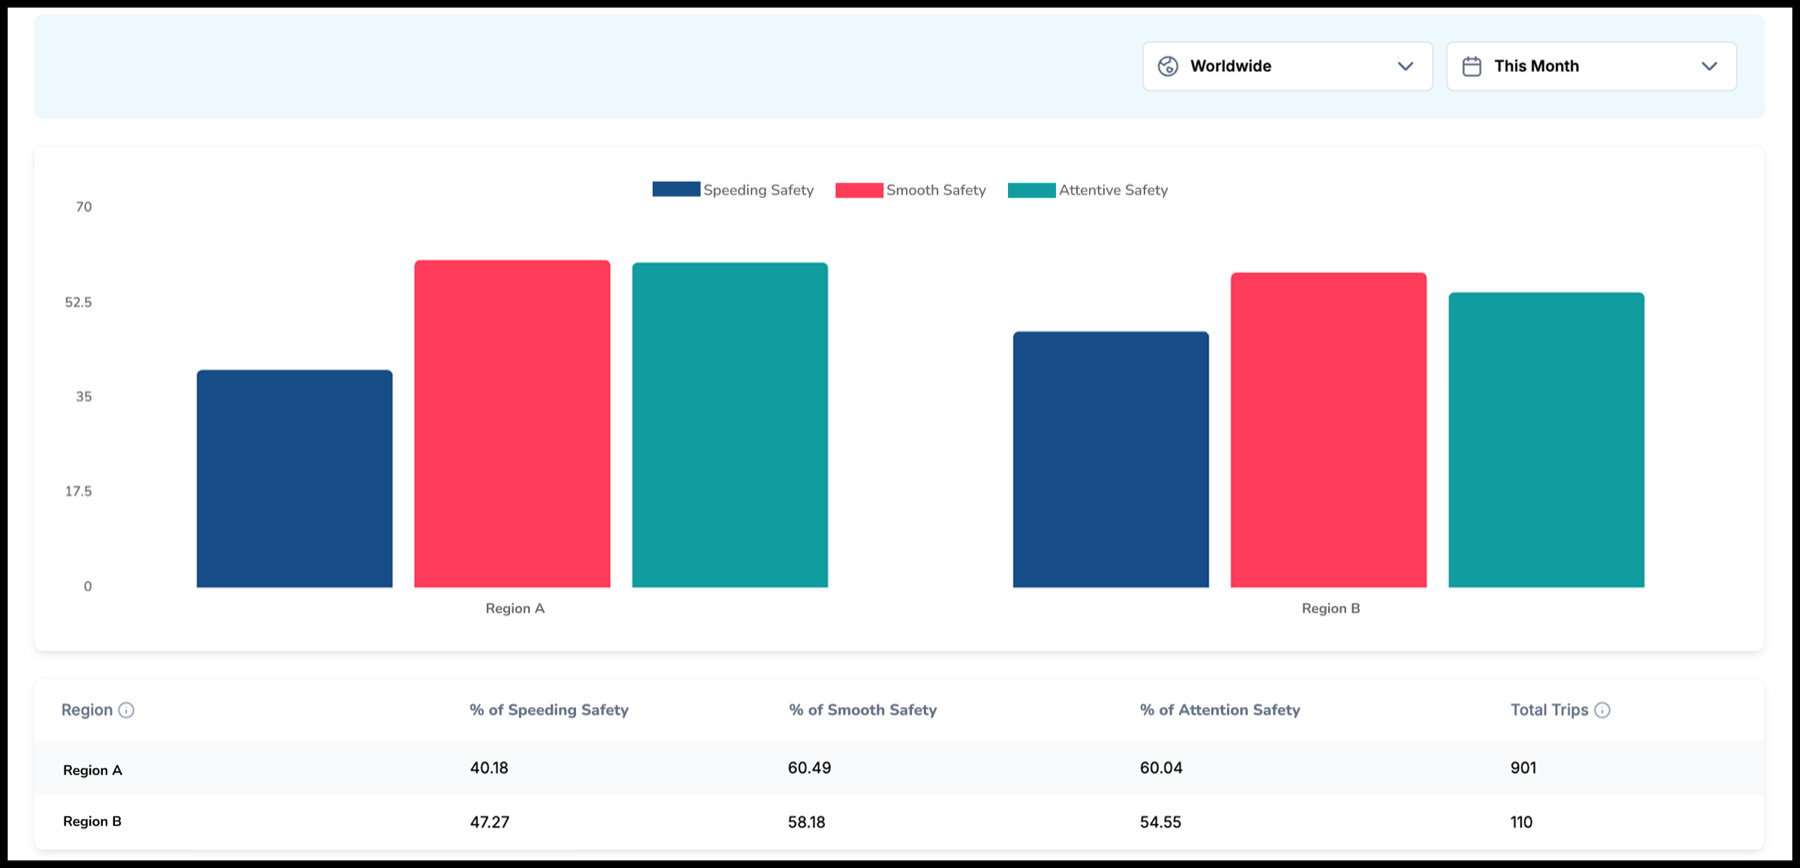
For the team. The weekly review is simpler to read. Your dashboards show the share of safe trips per city, this week against last, with the per-behavior rates underneath. After a no-calls campaign, you can see whether the calls-while-moving rate moved in that city, in the same number the riders see on their phones. Tiers work the way they did before; the difference is that riders are spread across them more widely, so the Excellent band means more and the riders just below it can see which rate to move.
What it doesn’t change
It doesn’t predict incidents. It tells you which trips met the standard and which didn’t.
It doesn’t re-score anything. Trip scores and sub-scores stay as they are; Safe Trip Rate is a second way of reading them.
It doesn’t round up. Each behavior is judged against its own standard, so a trip can be safe overall and still fail on calls while moving, and the rider will see that.
It doesn’t guess with thin data. A rider’s rate is shown only once there are enough trips behind it.
FAQ
Does it change anything on the phone, like battery or permissions? No. The rate is computed on Sentiance’s side from the trip scores your app already produces; nothing new runs on the phone and no new permission is requested. It does mean your trips need to sync to the cloud, so on-device-only deployments can’t use it.
Who decides what counts as a safe trip? Sentiance sets the standard per behavior and can adjust it for a fleet where road conditions justify it; it isn’t a dashboard setting. The tier bands, on the other hand, can be adjusted for your program.
Can riders see the per-behavior rates? Yes, where you choose to show them. The overall rate is the main rider-facing number; the speeding, smooth, and calls-while-moving rates can sit alongside it, plus any additional score in your configuration.
If your riders can’t say what their score means, let’s talk
Most delivery fleets already run a safety score, and most riders have a rough idea of their number. Fewer riders could tell you what it means or what to do about it, and that isn’t a rider problem. The measurement is usually fine; it’s the way the number is communicated that needs work.
Tell us about your program in the form below and we’ll set up a walkthrough. We’ll show you what your riders would see with Safe Trip Rate and how it reads for your ops and safety teams.
Already on Sentiance? Your Sentiance contact can walk you through adding Safe Trip Rate to your rider score.


