


Delivery operators know major matches influence demand. The challenge is understanding the full shape of that impact with greater precision: how much demand changes, which hours are affected, in which direction, and how the pattern differs from market to market.
World Cup 2026 was a rare chance to watch it happen everywhere at once: one tournament, dozens of markets, and a fixture list published months ahead. Running inside on-demand delivery platforms across Europe, the Middle East, and North Africa — on nothing more than the phones couriers already carry — Sentiance's on-device motion intelligence tracked how each match reshaped courier activity, hour by hour. Some markets surged at kickoff. Others emptied out and ordered later. Every one of those patterns was there on the schedule in advance.
But demand is only half the story, and the quieter half matters more. When orders spike into the small hours, riders push through and rush between drops. When the roads empty out for a match, the few still working open up on the clear tarmac. The same signal that shows how demand moved also shows how safely people drove through it — and wherever a match disrupted the normal flow, the riders still out got measurably riskier.
That's the real opportunity. Both the demand swing and the risk it creates show up on the fixture list before kickoff — so they're not something to react to. They're something to plan for.
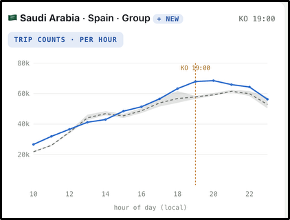
Saudi Arabia vs Spain — hourly delivery volume on match day (blue) vs a normal day (grey). Demand climbs through the 19:00 kickoff and holds elevated into the evening.
England - deliveries climb above the normal band around kickoff. In surge markets, the match pulls demand up.
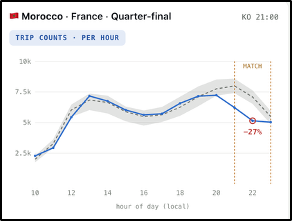
Morocco - deliveries fall below the normal band during the match. In dip markets, the country watches first and orders later.
How the World Cup Moved Delivery
World Cup 2026 was the perfect natural experiment: one tournament, dozens of markets, and a fixture list published months in advance. Running inside delivery platforms across Europe, the Middle East, and North Africa, Sentiance’s motion intelligence could watch the answer unfold everywhere at once - and the shapes were wonderfully different.
In some markets, kickoff created a surge. England turned every game into an ordering occasion: the dinner-time tie against DR Congo lifted transports more than 70% above normal, and a 1 a.m. kickoff against Mexico saw overnight orders more than double, up over 120%, from fans who decided a Round of 16 at 2 a.m. deserved proper catering. Saudi Arabia behaved the same way around its 3 a.m. matches, and Jordan - in its first-ever World Cup - pushed dawn ordering up to four times normal around its 05:00–07:00 kickoffs.
In others, kickoff was a dip. Across North Africa, football simply took over: during Morocco’s knockout matches, courier activity moved more than 30% away from a normal evening as the country stopped to watch, snapping back to normal within an hour of the final whistle. Egypt did the same when its matches hit prime evening hours, then invented a brand-new ordering occasion around its overnight 4 a.m. and 6 a.m. kickoffs.
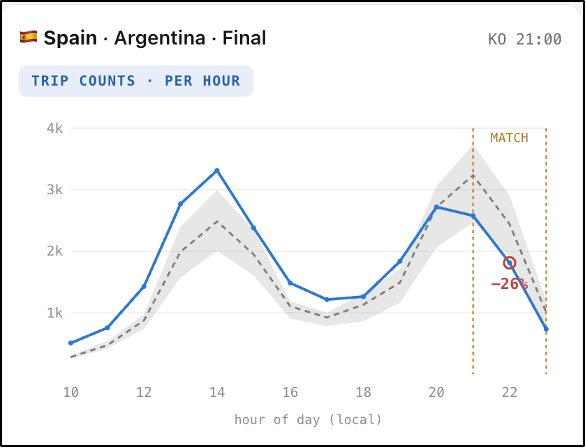
And in some markets the match barely registered in the numbers at all - Spain’s evening knockouts added only a gentle watch-at-home lift on top of already-strong demand. Surge, dip, or flat, every one of these patterns was visible on the fixture list months in advance. But demand is only half the story. The more important question for any delivery company is what these swings do to the riders out on the road.
What the Match Does to Rider Safety
The demand story is only half of it. Because Sentiance analyzes every ride- flagging risky events like speeding and harsh braking, and detecting crashes - we look past how much delivery moved and ask the question that matters to any delivery company: did the riders still on the road get less safe? Comparing each match window against the same clock hours on normal days, the answer is consistent across markets. Wherever a match disrupts the normal delivery flow, the drivers still out get measurably riskier.
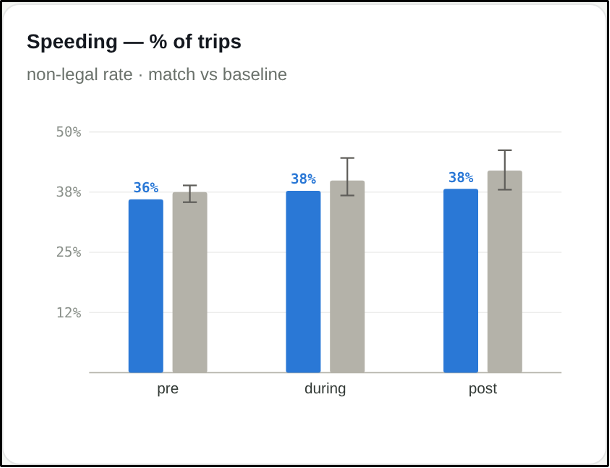
In England, the dinner-time kickoff sent demand surging - and with far more couriers on the road at once, speeding climbed to 48% of trips during the match, above the normal range, while overall safety dropped below its usual band. The risk here is speed, and it fades once the final whistle blows.
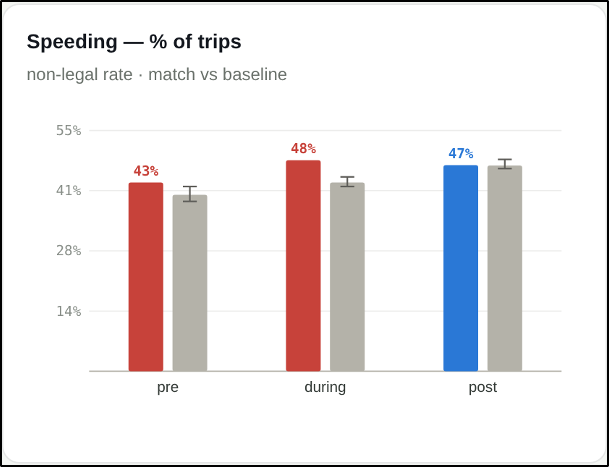
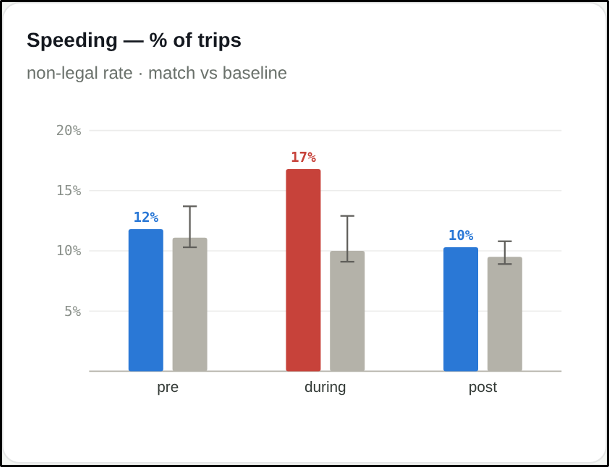
Morocco is the mirror image, and in some ways the more striking one. Demand fell during the match as couriers and customers stopped to watch - yet the few drivers still working got sharply riskier. Speeding events increased by 17% across recorded trips, 68% above normal, on emptier, faster-moving roads. Then the post-match rebound brought roughly 17% more harsh braking and acceleration events as couriers rushed back out all at once.
The proof that this is really about the demand shock - and not simply "a match day" - comes from Spain. Its evening kickoff barely moved demand, and safety held normal in every window: speeding sat at or below baseline throughout, and nothing breached the risk band. Where the match doesn’t disrupt the flow, driving doesn’t get riskier. That is exactly what ties the England and Morocco effects to the surge and the dip, rather than to the calendar.
This is where scoring turns into action. Because the risky windows line up with the fixture list, a delivery company doesn’t have to wait for incidents to happen - it can time safety nudges to the exact during and post-match hours when speeding and harsh events spike, trigger them on the demand shock rather than the date, and focus on the zones surging hardest around kickoff. The pattern is situational, so the fix is timing and messaging - not penalising individual riders.
The Technology Behind the Insight
All of this comes from the smartphone couriers already carry - no extra hardware, no order data, no personal data tracking.
Sentiance's on-device AI turns phone sensor signals into an understanding of movement: trips, modes, hours on the road. The same signals power behavioural safety intelligence - scoring how safely each trip is driven, flagging risky events, and detecting crashes - so the picture is never just how much activity moved, but how safely it happened. Aggregated across a fleet and compared against a statistical "normal" for each market and each hour, it reveals precisely how an event reshapes activity - while raw data stays on the device, privacy-preserved by design.
Each market is measured against its own baseline, so the shapes are the story: the kickoff surge in London, the post-whistle return in Casablanca, the dawn celebration in Amman.
Turning the Fixture List Into a Playbook
Every one of these patterns was visible months in advance, and the effects are large, hour-specific, and local. That's a gift for anyone running a delivery operation - and not only for planning demand. And as the safety data showed, those same surges and dips are exactly when the riders still on the road get less safe. Because the risky windows line up with the fixture list, a delivery company can act before the surge rather than after: brief riders ahead of a late kickoff, plan breaks around the small-hours rush, and time safety nudges to the during- and post-match hours when speeding and harsh events spike.
In markets like England and Saudi Arabia, kickoff is a demand occasion to prepare for: staff up for the surge, own the pre-match promo slot ("order before kickoff" writes itself), and keep kitchens ready deep into the night when the schedule calls for it - while safety scoring keeps watch over the riders working those late, tired hours.
In markets like Morocco and Egypt, the rhythm is just as useful: a pre-match ordering window, ninety minutes where the nation watches together, and a reliable post-whistle return - perfect for timing rider breaks, targeting incentives at the rebound, and meeting the fleet's return to the road with per-rider safety scoring and well-timed nudges, so the busiest post-match hours don't become the most dangerous ones.
And football is just the test case. Swap "match" for a sunny weekend, a public holiday, payday, or a marketing campaign, and the same approach shows exactly how each event shapes demand. Joined to an operator's own order and revenue data, the shape of the shift becomes money.
Key Results
- Saudi Arabia: courier activity +30–50% around a 3 a.m. kickoff — fans made a night of it
- England: more than +70% at dinner-time kickoff vs DR Congo; overnight orders more than doubled (over +120%) for the 1 a.m. Mexico tie
- Morocco: a nation watching together — activity shifted by more than 30% toward the football during matches, back to normal within an hour of the whistle
- Jordan: dawn ordering up to four times normal for the country's first-ever World Cup matches
- Egypt: full attention during the match, ordering rebounded within two hours
- Safety impact, measured: where a match disrupted the delivery flow, the riders still out got measurably riskier - speeding hit 48% of trips during England’s surge and jumped around 68% above normal on Morocco’s emptier roads
- The control that proves it: in Spain, where demand barely moved, safety held normal in every window - so the risk tracks the demand shock, not the calendar
- Every pattern predictable from a fixture list published months in advance — so demand surges, and the rider safety exposure they create, can be managed before they hit
Because when the whistle blows, the delivery companies who saw it coming win the night - and keep their riders safe through it.
A note on the numbers: safety figures reflect behavioural risk indicators - speeding and harsh-event rates scored from phone sensors - not crash counts. Each market is compared only against its own pre-tournament baseline, so absolute rates aren’t comparable across markets.